76
Comparison of Full and Reduced Systems for HHA Fiber
100

50
0
0 100 200 300 400 500 600 700 800 900 1000
Time (ms)
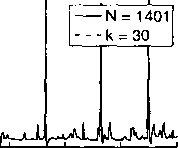
Figure 3.2: Comparison of somatic voltage traces as computed by the full (solid) and
reduced (dashed) systems for the HHA fiber. Although two curves are plotted, only one
is seen because the reduced system is so accurate (kυ = kf = 30) that it nearly exactly
reproduces the dynamics.
3.3.2.1 Phantom Spiking
We desire a reduced model that will reproduce the correct dynamics of the full
model independent of the location of the inputs. In order to capture spiking behavior,
this implies that the snapshots to be used must contain local descriptions of action
potentials. For example, on the fiber we needed to ensure that each node experienced
spike dynamics. This was accomplished by initiating a spike at one end and allowing
it to travel to the other end (this includes the after-hyperpolarization as well).
For the forked neuron, isolating the local spiking behavior is not so simple because
each spike that is initiated will split upon reaching the junction point, and thus at
least two branches will contain a spike at the same time. Such a situation is not
good, because the snapshots will contain information about both spikes simultane-
ously, causing phantom spiking. This phenomenon consists of stimulus arriving at one
location, but, because of the simultaneous spikes in the snapshots, a similar output
is observed at a different location on another branch, thus corrupting the computed
More intriguing information
1. Wirtschaftslage und Reformprozesse in Estland, Lettland, und Litauen: Bericht 20012. An Intertemporal Benchmark Model for Turkey’s Current Account
3. Evolutionary Clustering in Indonesian Ethnic Textile Motifs
4. The name is absent
5. The name is absent
6. Detecting Multiple Breaks in Financial Market Volatility Dynamics
7. Climate change, mitigation and adaptation: the case of the Murray–Darling Basin in Australia
8. Income Growth and Mobility of Rural Households in Kenya: Role of Education and Historical Patterns in Poverty Reduction
9. Exchange Rate Uncertainty and Trade Growth - A Comparison of Linear and Nonlinear (Forecasting) Models
10. The name is absent