Chapter 5
samples that were not shaken have loose solids layers. The samples that were
shaken have more compact solids layers.
Sample: 7 8
Adding: NaOH
I. pH: 8.5 8.8
E. pH: 8.0-8.5 8.5
9 10 11
NaOH Na2SiO3
Shaking Shaking Shaking
8.5 8.8 8.8
8.0-8.5 8.5 8.5
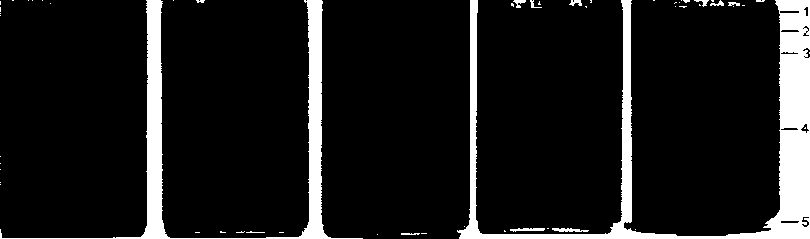
Figure 5.4 Photographs of 24 h emulsion with NaOH or Na2SiO3 at different pH
Figs. 5.5 - 5.7 show photomicrographs obtained by sampling from the five
different positions indicated on the right side in Figure 5.4. Sample 7, which is not
shaken, exhibits rigid skins in the rag layer (in Figure 5.5). Sample 8 has similar
results, though the pH was increased. In contrast, all three samples that are
shaken exhibit oil-in-water emulsions at the two highest sampling positions. A few
skins are seen in the lowest sampling position of sample 9, where nothing was
added and pH remained at 8.5 (Figure 5.6). No skins are seen for samples 10,
where pH was raised to 8.8 (in Figure 5.7). Sample 11 has similar results to
Sample 10.
155
More intriguing information
1. GENE EXPRESSION AND ITS DISCONTENTS Developmental disorders as dysfunctions of epigenetic cognition2. he Effect of Phosphorylation on the Electron Capture Dissociation of Peptide Ions
3. EMU's Decentralized System of Fiscal Policy
4. The bank lending channel of monetary policy: identification and estimation using Portuguese micro bank data
5. The name is absent
6. Workforce or Workfare?
7. Top-Down Mass Analysis of Protein Tyrosine Nitration: Comparison of Electron Capture Dissociation with “Slow-Heating” Tandem Mass Spectrometry Methods
8. Geography, Health, and Demo-Economic Development
9. Gerontocracy in Motion? – European Cross-Country Evidence on the Labor Market Consequences of Population Ageing
10. Regional science policy and the growth of knowledge megacentres in bioscience clusters