Chapter 5
and 6.0. At pH 6.0 (Figure 5.11), the top of the oil layer is clean oil. At the bottom
of the oil layer is oil-in-water emulsion with relatively low oil concentration. At pH
8.5, the emulsion has similar result to that at pH 6.0. At pH 5.0 (Figure 5.10), the
top of oil layer is clean oil, but in this case the bottom of the oil layer is oil with a
few drops of dispersed water. The water layer is also almost clean. Emulsion
samples at pH 5.0 and 6.0 have different emulsion type. Thus the original
oil-in-water emulsion remains stable at pH 6.0, but not at pH 5.0.
1. Top of the oil layer
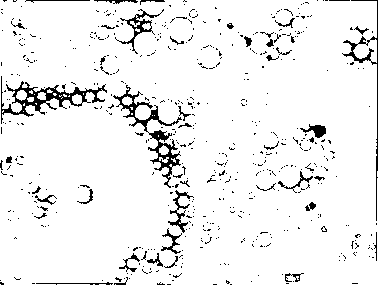
3. Near oil∕water interface
2. Middle of the oil layer
4. Water layer
(The scale bar is 20 μm)
Figure 5.11 24 h emulsion sample adding HCI (equilibrium pH 6.0)
163
More intriguing information
1. ARE VOLATILITY EXPECTATIONS CHARACTERIZED BY REGIME SHIFTS? EVIDENCE FROM IMPLIED VOLATILITY INDICES2. The name is absent
3. The Impact of EU Accession in Romania: An Analysis of Regional Development Policy Effects by a Multiregional I-O Model
4. The name is absent
5. Demand Potential for Goat Meat in Southern States: Empirical Evidence from a Multi-State Goat Meat Consumer Survey
6. References
7. Revisiting The Bell Curve Debate Regarding the Effects of Cognitive Ability on Wages
8. The name is absent
9. On Evolution of God-Seeking Mind
10. Modelling the health related benefits of environmental policies - a CGE analysis for the eu countries with gem-e3