102
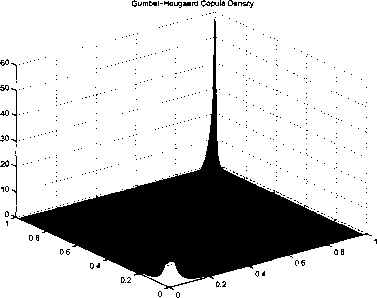
Figure A.5: Density Plot of a Gumbel-Hougaard Copula (τ = 0.8)
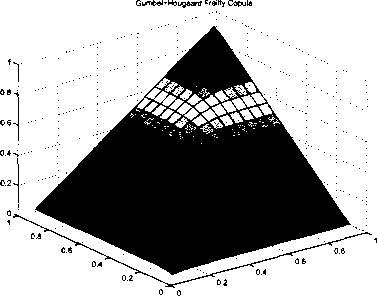
Figure A.6: Gumbel-Hougaard Copula CDF Plot (τ = 0.8)
More intriguing information
1. Epistemology and conceptual resources for the development of learning technologies2. Monetary Policy News and Exchange Rate Responses: Do Only Surprises Matter?
3. Co-ordinating European sectoral policies against the background of European Spatial Development
4. Sector Switching: An Unexplored Dimension of Firm Dynamics in Developing Countries
5. The name is absent
6. Demand Potential for Goat Meat in Southern States: Empirical Evidence from a Multi-State Goat Meat Consumer Survey
7. Announcement effects of convertible bond loans versus warrant-bond loans: An empirical analysis for the Dutch market
8. Discourse Patterns in First Language Use at Hcme and Second Language Learning at School: an Ethnographic Approach
9. The name is absent
10. The Folklore of Sorting Algorithms