15
θ-∣ = O θ2 θɜ
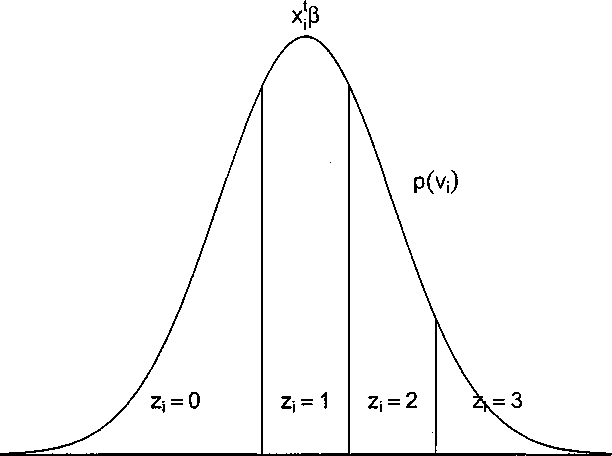
Figure 2.1: Distribution of the latent random variable t⅛ ~ N(xtiβ, 1) according to Albert
and Chib’s model considering four categories, K = 3. The cutpoints θ% and Θ3 are random.
The observed value ⅛ is indicator of the interval where Vi falls.
More intriguing information
1. Explaining Growth in Dutch Agriculture: Prices, Public R&D, and Technological Change2. Who’s afraid of critical race theory in education? a reply to Mike Cole’s ‘The color-line and the class struggle’
3. L'organisation en réseau comme forme « indéterminée »
4. Fiscal Rules, Fiscal Institutions, and Fiscal Performance
5. HACCP AND MEAT AND POULTRY INSPECTION
6. Towards a Strategy for Improving Agricultural Inputs Markets in Africa
7. Death as a Fateful Moment? The Reflexive Individual and Scottish Funeral Practices
8. Quality Enhancement for E-Learning Courses: The Role of Student Feedback
9. Higher education funding reforms in England: the distributional effects and the shifting balance of costs
10. TECHNOLOGY AND REGIONAL DEVELOPMENT: THE CASE OF PATENTS AND FIRM LOCATION IN THE SPANISH MEDICAL INSTRUMENTS INDUSTRY.