30
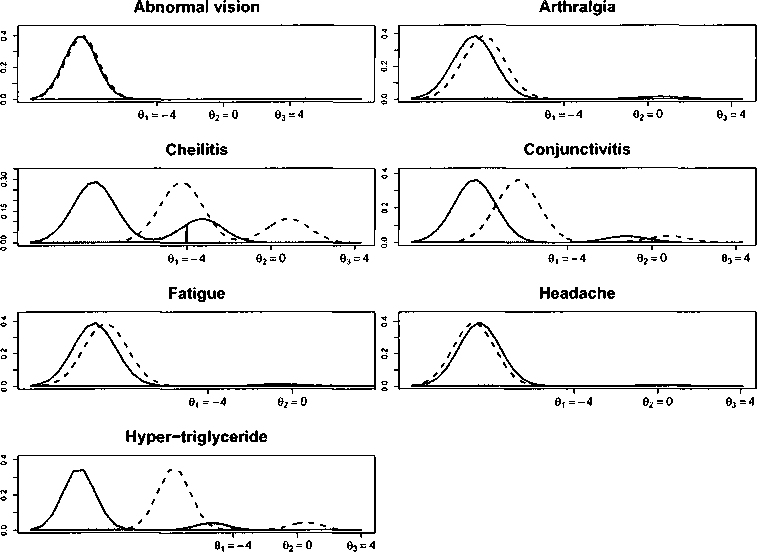
Figure 2.4: Estimated mixture of normal distribution of the latent variable ι⅛∙ con-
ditioned on τi — 0 for j = 1,..., 7. Shaded curve corresponds to placebo (x = — 1)
and dashed to isotretinoin (τ = 1). Darkly and lightly shaded areas represent, re-
spectively, the probability of no toxicity (πj∙0) and toxicity at grade 1 (π7∙1) under
placebo.
2.7 Discussion
We have proposed a Bayesian hierarchical model to analyze ordinal data nested within
categories. Our model characterizes the ordinal∕categorical data structure by a varia-
tion of the ordinal probit model. We provide posterior summaries to assess treatment
effects. In the phase III clinical trial example, traditional analysis might simply group
the toxicities levels into two: no toxicity (0) and some toxicity (1+2+3+4), and then,
apply a Chi-squared test or Fisher’s exact test to compare the two treatment groups
More intriguing information
1. ROBUST CLASSIFICATION WITH CONTEXT-SENSITIVE FEATURES2. Hemmnisse für die Vernetzungen von Wissenschaft und Wirtschaft abbauen
3. The name is absent
4. The name is absent
5. The name is absent
6. Business Networks and Performance: A Spatial Approach
7. Pass-through of external shocks along the pricing chain: A panel estimation approach for the euro area
8. The name is absent
9. A simple enquiry on heterogeneous lending rates and lending behaviour
10. Detecting Multiple Breaks in Financial Market Volatility Dynamics