capacity of this chapter. Figure 2.0 is a general purification diagram (covering
objects 1.0-3.1) which at a high level illustrates the purification process from an
unclean (object 1.0) to clean (object 3.0) state.
Figure 3.0 - Purification Model, 1952-19604
1.1 Offenses
Offense Type (Murder, Theft)
OffenseDate
OffenseResuIt
1—(l.0 Unclean)
(з.О Clean)-+
¥
j⅛≤(3.1 Reιnw⅛<l Offenses)
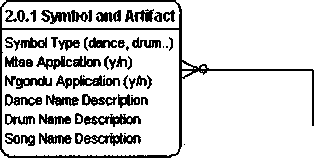
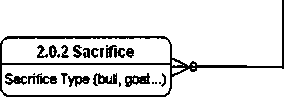
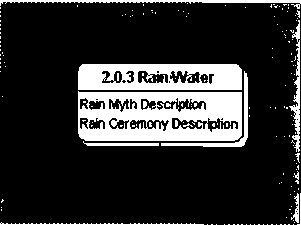
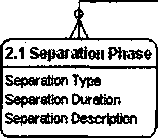
2.0 Purification
AffKed Name
Purification Reason
Puriftn Type (Trad, Church)
Purification Organization Name
Purification Specialist Name
Purification Date
Purification Locffion
Purification Completion Date
Oender Indicator(MIF)
Payment type(animal, money..)
PaymentAmourt
2.2 Uininal
Restiype
Rest Duration
о
A
(2.1.1 ItivokeSpffits)
(2.1.2 Pinging NegatMty) (2.2.1 Strengthening)
0
A
(2.2.2 Heating)
> .......>
2.0.4 Ancestor ⅜Spirit Type
Spirit Type Description
Ancestor Description
Local Ancestor (ylh)
Family Head Ancestor (yih)
LocationHead Ancestor (yJh)
{>
A
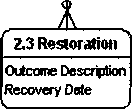
(2.3.1 RetumtoCommuniiy)
4Figure 3.0 Represents my interpretation of the purification process
191
More intriguing information
1. BILL 187 - THE AGRICULTURAL EMPLOYEES PROTECTION ACT: A SPECIAL REPORT2. Structural Breakpoints in Volatility in International Markets
3. EDUCATIONAL ACTIVITIES IN TENNESSEE ON WATER USE AND CONTROL - AGRICULTURAL PHASES
4. SOCIOECONOMIC TRENDS CHANGING RURAL AMERICA
5. THE CHANGING STRUCTURE OF AGRICULTURE
6. Economie de l’entrepreneur faits et théories (The economics of entrepreneur facts and theories)
7. Flatliners: Ideology and Rational Learning in the Diffusion of the Flat Tax
8. Job quality and labour market performance
9. The name is absent
10. Financial Development and Sectoral Output Growth in 19th Century Germany