cβ
E
ω
φ
о
со
S
>
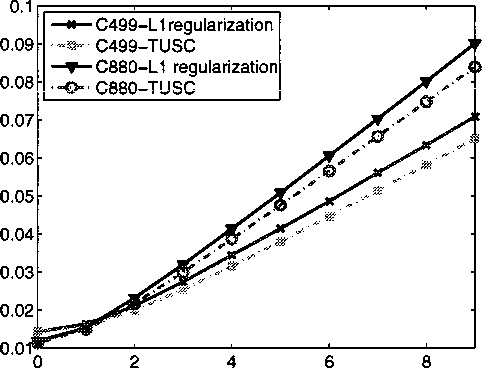
Measurement noise %
Figure 6.2: Variations estimation error vs. percent of the power measurement noise.
This decay suggests that it is not possible to find variation of all gates indepen-
dently because there is no information about the null space of the measurement
matrix, JV(A) = {y ∈ RA∣Ay = 0}. Thus, we can only estimate the variation in
a subspace S that does not contain JV(A).
6.2.2 Tomography results in the power framework
To study the performance of the proposed tomography method, we have simulated
the process variation on a number of MCNC benchmarks. A total of 12% variation
is assumed in the simulations. Based on the data in [16] and [76], 20% of the
total variation is inter-die variation, 60% is spatial correlated intra-die variation,
and 20% is random uncorrelated variation. To model the leakage current (static
69
More intriguing information
1. A Location Game On Disjoint Circles2. Plasmid-Encoded Multidrug Resistance of Salmonella typhi and some Enteric Bacteria in and around Kolkata, India: A Preliminary Study
3. The name is absent
4. Protocol for Past BP: a randomised controlled trial of different blood pressure targets for people with a history of stroke of transient ischaemic attack (TIA) in primary care
5. The name is absent
6. BODY LANGUAGE IS OF PARTICULAR IMPORTANCE IN LARGE GROUPS
7. The name is absent
8. Natural hazard mitigation in Southern California
9. On the Desirability of Taxing Charitable Contributions
10. The name is absent