103
-50
50 -50
50
Distance (μm)
Distance (μm)
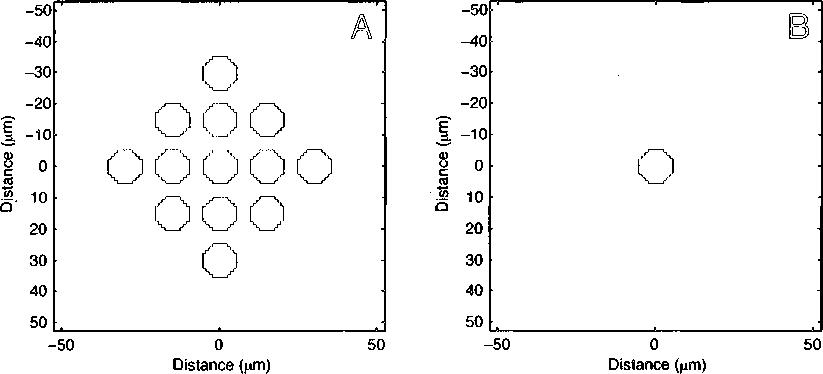
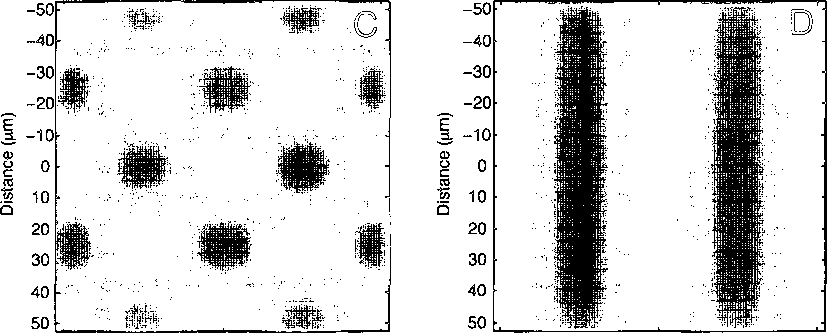
Figure 5.10 : (A, B) Rod network with rod diameter a = 10 μm and rod spacing D = 16 μm.
(A) Rod network with coupling. Colors represent relative response amplitudes from expo-
nential decay. (B) Uncoupled rod network. (C) Example of a two-dimensional sinusoidal
grating. (D) Example of a one-dimensional grating.
More intriguing information
1. Effects of red light and loud noise on the rate at which monkeys sample the sensory environment2. The technological mediation of mathematics and its learning
3. A Classical Probabilistic Computer Model of Consciousness
4. Flatliners: Ideology and Rational Learning in the Diffusion of the Flat Tax
5. The Importance of Global Shocks for National Policymakers: Rising Challenges for Central Banks
6. The name is absent
7. DURABLE CONSUMPTION AS A STATUS GOOD: A STUDY OF NEOCLASSICAL CASES
8. WP 92 - An overview of women's work and employment in Azerbaijan
9. Migration and Technological Change in Rural Households: Complements or Substitutes?
10. Telecommuting and environmental policy - lessons from the Ecommute program