106
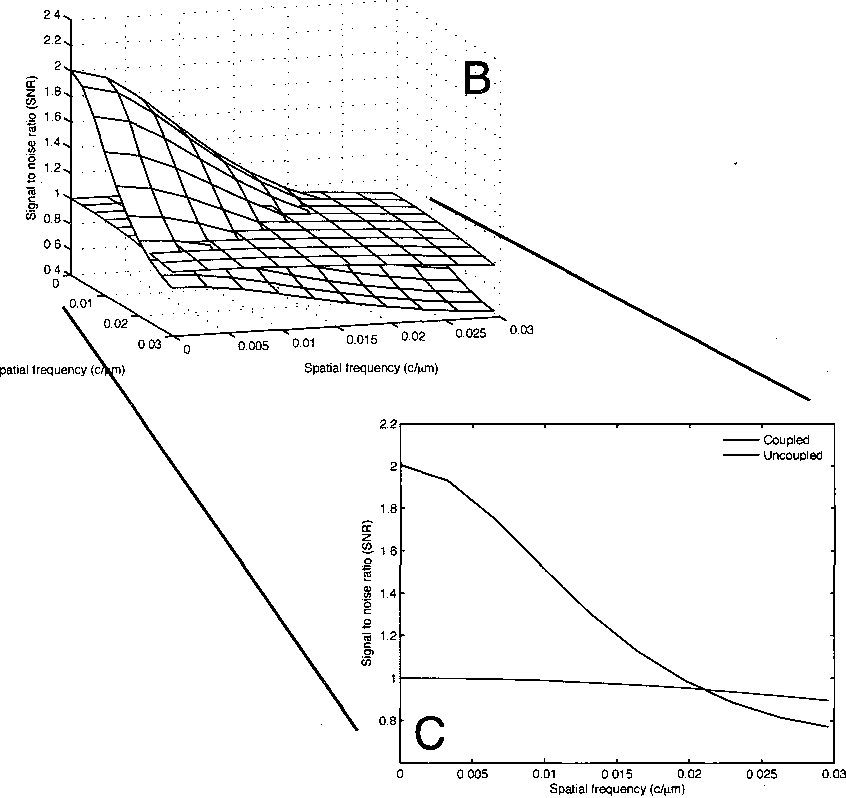
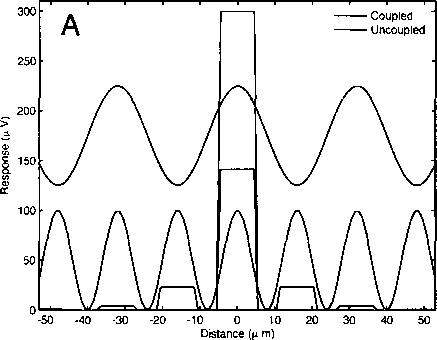
Figure 5.12 : (A) Example of aliasing in the rod network. The first sinusoid is at the critical
frequency (0.5 c∕rod 0.03 c∕micron). The second sinusoid is aliased by the rods, causing
the second peak in the rod responses shown in figure 5.11. (B) Signal-to-noise ratio with
unit sinusoidal input and unit noise variance in each rod vs two-dimensional frequency
components. (C) A projection along the x axis of the plot in B.
More intriguing information
1. Insecure Property Rights and Growth: The Roles of Appropriation Costs, Wealth Effects, and Heterogeneity2. The name is absent
3. Direct observations of the kinetics of migrating T-cells suggest active retention by endothelial cells with continual bidirectional migration
4. Experimental Evidence of Risk Aversion in Consumer Markets: The Case of Beef Tenderness
5. CAN CREDIT DEFAULT SWAPS PREDICT FINANCIAL CRISES? EMPIRICAL STUDY ON EMERGING MARKETS
6. fMRI Investigation of Cortical and Subcortical Networks in the Learning of Abstract and Effector-Specific Representations of Motor Sequences
7. PER UNIT COSTS TO OWN AND OPERATE FARM MACHINERY
8. DURABLE CONSUMPTION AS A STATUS GOOD: A STUDY OF NEOCLASSICAL CASES
9. AJAE Appendix: Willingness to Pay Versus Expected Consumption Value in Vickrey Auctions for New Experience Goods
10. The name is absent