76
Response-Intensity Curves
Intensity
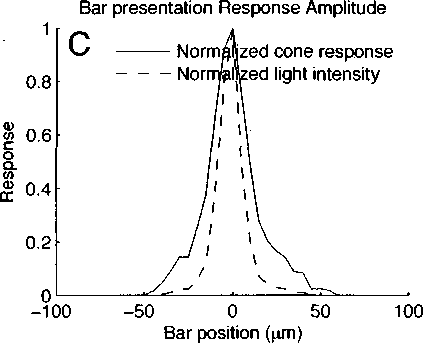
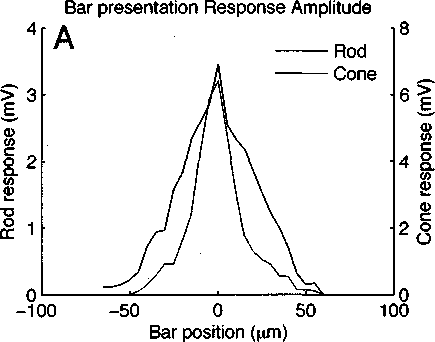
Figure 5.2 : (A) Average maximum response amplitudes for rods (n=6) and cones (n=3)
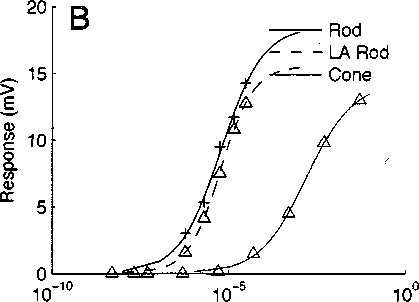
averaged over two directions. (B) Maximum response amplitude vs logarithmic light in-
tensity of a whole-field flash stimulus for dark adapted and background light adapted rods
and cones fit with the Hill equation V = A∕(l + (Λ'1∕2∕x)n)∙ (ɑ) Normalized cone response
compared with cone stimulus transformed by cone response sensitivity in B to yield stimulus
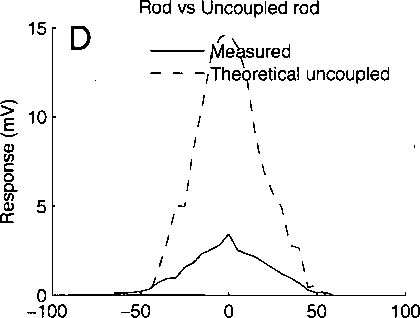
intensity. (D) Measured rod response compared with theoretical uncoupled rod response
from transforming stimulus intensity from C with rod sensitivity in B.
Bar position (μm)
More intriguing information
1. Research Design, as Independent of Methods2. Population ageing, taxation, pensions and health costs, CHERE Working Paper 2007/10
3. Enterpreneurship and problems of specialists training in Ukraine
4. Public infrastructure capital, scale economies and returns to variety
5. QUEST II. A Multi-Country Business Cycle and Growth Model
6. The name is absent
7. The name is absent
8. Achieving the MDGs – A Note
9. The name is absent
10. The name is absent