77
spatial response of a single rod.
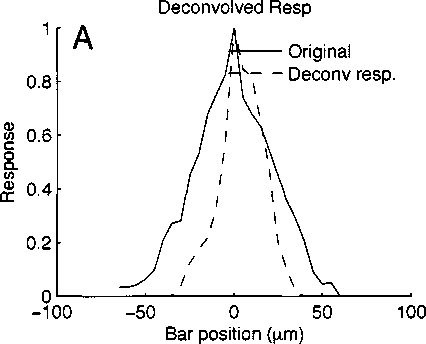
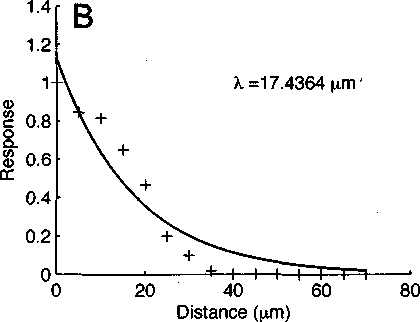
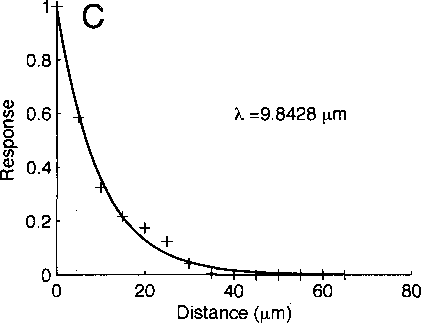
Figure 5.3 : Estimated space constant of of rod network. (A) Normalized rod response
compared with rod response deconvolved with theoretical isolated rod response from fig-
ure 5.2 D. (B, C) Each side of the deconvolved response fit with a single exponential decay
r - к exp (-æ/(ʌin)). Values of λ of 17.4 and 9.8 μm correspond through equation 5.5 to
7 =0.91 and 3.31, respectively. Assuming an isolated rod membrane impedance Rm ≈ 300
MΩ, these values of gamma predict a coupling resistance Rc of 272 and 994 MΩ.
Figure 5.2D shows the theoretical isolated rod response to the light bar compared to
the actual rod response in the network. The theoretical isolated rod response has a larger
amplitude than the actual response due to an absence of signal spread to coupled rods. Next,
More intriguing information
1. The growing importance of risk in financial regulation2. The Integration Order of Vector Autoregressive Processes
3. Learning and Endogenous Business Cycles in a Standard Growth Model
4. The name is absent
5. Cryothermal Energy Ablation Of Cardiac Arrhythmias 2005: State Of The Art
6. Geography, Health, and Demo-Economic Development
7. Feature type effects in semantic memory: An event related potentials study
8. EXECUTIVE SUMMARY
9. Education and Development: The Issues and the Evidence
10. Impact of Ethanol Production on U.S. and Regional Gasoline Prices and On the Profitability of U.S. Oil Refinery Industry