2.3 Results and discussion
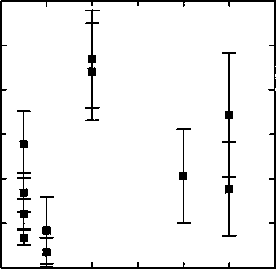
Fits to Equation 2.1 yield the lipid surface charge density σsampie, as a function of Xps as
shown in Figure 2.2. The error bars reflect contributions from the uncertainty in each
parameter.
0.012
„ 001
CM
E
U 0.008
o>
E 0.006
cc
ω
Ü
I 0.004
0.002
0
0 0.1 0.2 0.3 0.4 0.5 0.6
Xps
Figure 2.2: The lipid membrane charge densities determined by applying Equation 2.1 to
the experimental force curves. The data do not follow the expected trend with DOPS
mole fraction.
The use of Equation 2.1 in interpreting the data gives a result that shows no discernable
trend, and the variation cannot be accounted for by the error. This is not entirely
unexpected, considering the approximations that go into the derivation of Equation 2.1.
In our measurements, the tip radii are significantly larger than the Debye length. In
addition, the values of D that must be fit, approach λ at short range and exceed R at long
range. Also, the surface potentials greatly exceed the range where the linearized Poisson-
Boltzmann equation is applicable. Note that the negative result of Figure 2.2 does not
necessarily mean that the functional dependences in Equation 2.1 are inaccurate. Several
experiments have confirmed that Equation 2.1 accurately predicts the force dependence
22
More intriguing information
1. The English Examining Boards: Their route from independence to government outsourcing agencies2. The name is absent
3. Review of “From Political Economy to Economics: Method, the Social and Historical Evolution of Economic Theory”
4. Migrant Business Networks and FDI
5. Quality Enhancement for E-Learning Courses: The Role of Student Feedback
6. Emissions Trading, Electricity Industry Restructuring and Investment in Pollution Abatement
7. Education Responses to Climate Change and Quality: Two Parts of the Same Agenda?
8. Developing vocational practice in the jewelry sector through the incubation of a new ‘project-object’
9. PROTECTING CONTRACT GROWERS OF BROILER CHICKEN INDUSTRY
10. INSTITUTIONS AND PRICE TRANSMISSION IN THE VIETNAMESE HOG MARKET