on D, R, λ, and pH, but usually by only varying one parameter [35, 37-43, 54]. Also, the
analytical model significantly underestimates the magnitude of the sample charge
density. Thus, in order to circumvent the restrictive assumptions used in deriving
Equation 2.1, the experimental data was interpreted by solving the full PB equation with
a Finite Element numerical simulation of the AFM lipid system [1]. The tip radius and
spring constants were measured and the tip-sample force was obtained by solving the
nonlinear Poisson-Boltzmann equation under normal boundary conditions [36, 48-51]-
which is in this case equivalent to surface charge density of the lipid. The boundary
condition was adjusted in the simulation and fit with the averaged force curve data. The
best fit of the simulation to the experimental data was interpreted as the surface charge
density of the lipid as shown in the Figure 2.3.
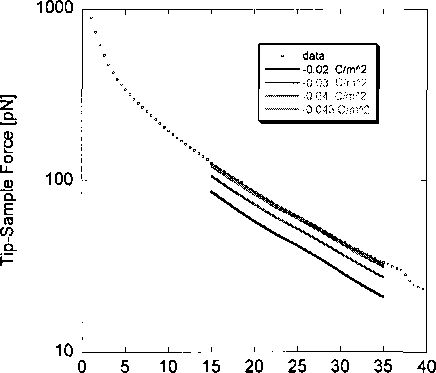
Tip-Sample Separation [nm]
Figure 2.3: Comparing data and simulation results. Each solid, colored line represents the
computationally simulated force curve obtained by using various guesses as to the lipid
surface charge density. Note that the data is fit to the model only in the long-range region
(1—4 Debye lengths).
23
More intriguing information
1. The name is absent2. Publication of Foreign Exchange Statistics by the Central Bank of Chile
3. Party Groups and Policy Positions in the European Parliament
4. The name is absent
5. The open method of co-ordination: Some remarks regarding old-age security within an enlarged European Union
6. The name is absent
7. Transgression et Contestation Dans Ie conte diderotien. Pierre Hartmann Strasbourg
8. Thresholds for Employment and Unemployment - a Spatial Analysis of German Regional Labour Markets 1992-2000
9. The name is absent
10. Happiness in Eastern Europe