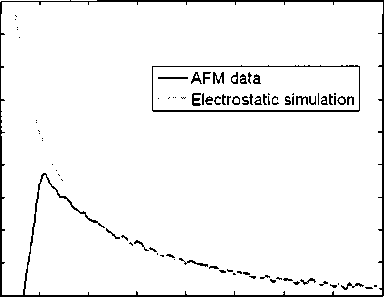
As shown in Figure 3.2, the results obtained from the model given in Chapter 2 start
deviating from the AFM data at short tip-sample separations (11 nm and less in the figure
below).
450
400
350
300
(a) S250
200
150
100
50
° 5 10 15 20 25 30 35 40
Tip-sample separation D (nm)
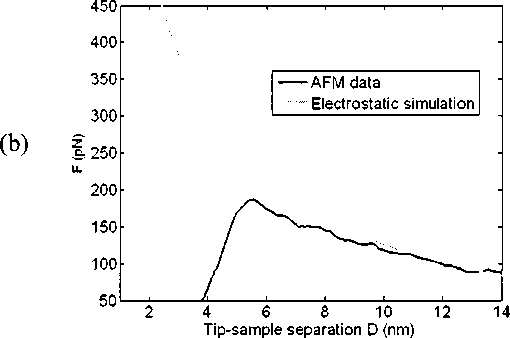
Figure 3.2: (a) The fixed charged density model is a good fit for the data for D > 11 nm.
(b) A closer view of the same data shown in (a) reveals that the simulation deviates from
the data when D < 11 nm. The data is for a 1:5, DOPC:DOPS mixture.
The fixed surface charge density model of Chapter 2 consistently over-estimates the force
in the short-range. Thus, we reason that the short-range correction must be due to a
lessening in repulsion between the tip and the lipid. We will first show that the van der
Waals interaction between the tip and the sample does not account for the observed short
ranged deviation. Next, we will demonstrate that the AFM tip-induced counterion
28
More intriguing information
1. Testing the Information Matrix Equality with Robust Estimators2. Optimal Tax Policy when Firms are Internationally Mobile
3. Pursuit of Competitive Advantages for Entrepreneurship: Development of Enterprise as a Learning Organization. International and Russian Experience
4. The name is absent
5. The name is absent
6. Announcement effects of convertible bond loans versus warrant-bond loans: An empirical analysis for the Dutch market
7. CREDIT SCORING, LOAN PRICING, AND FARM BUSINESS PERFORMANCE
8. Experimental Evidence of Risk Aversion in Consumer Markets: The Case of Beef Tenderness
9. Foreign Direct Investment and the Single Market
10. The name is absent