72
RICE UNIVERSITY STUDIES
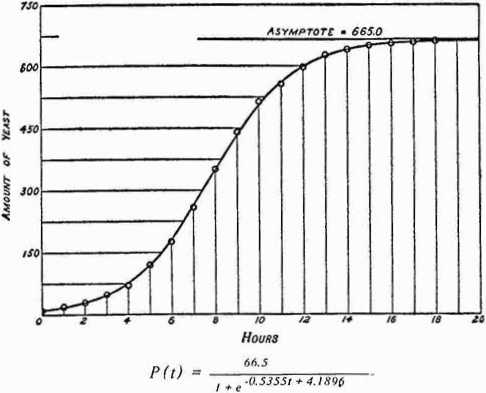
FIGURE 6. The Logistic Curve: Growth of a population of yeast
cells, taken from R. Pearl (Rcf. 10).
SAfOf 77/AV Aff AfCfAArVOcZOtV
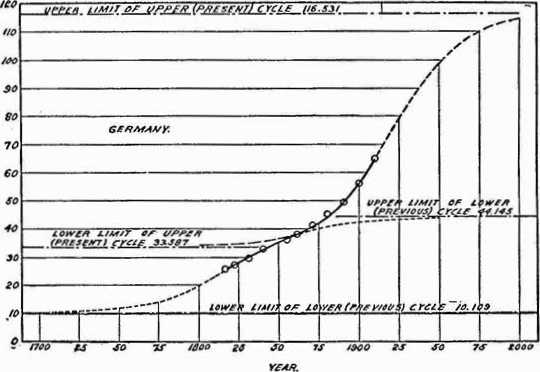
For the period up to 1855, r(t) = 10.109 + —— - nniilj-
I t 2.495e u uj 4
From 1855 on, P(t) = 33.587 + —^---------
'l+297.546e,,-°∙,7-'
FIGURE 7. Tlic population growth of Germany, showing two
cycles of growth which have overlapped during the
period of census history.
More intriguing information
1. Co-ordinating European sectoral policies against the background of European Spatial Development2. Popular Conceptions of Nationhood in Old and New European
3. Income Mobility of Owners of Small Businesses when Boundaries between Occupations are Vague
4. The name is absent
5. The name is absent
6. The Institutional Determinants of Bilateral Trade Patterns
7. Wirtschaftslage und Reformprozesse in Estland, Lettland, und Litauen: Bericht 2001
8. The name is absent
9. The Clustering of Financial Services in London*
10. Macro-regional evaluation of the Structural Funds using the HERMIN modelling framework