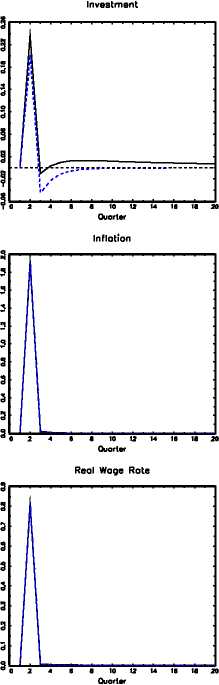
Figure 7
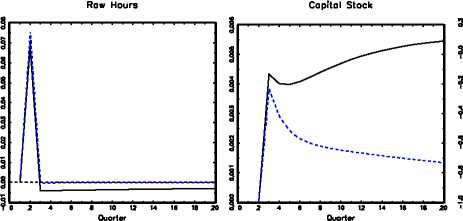
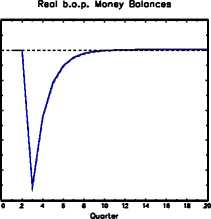
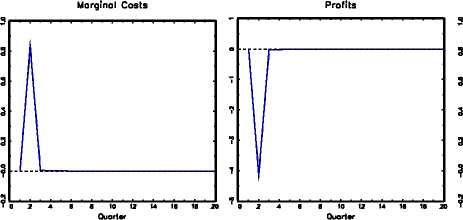
Monetary Shock in the Representative Agent Economy
Thetahut
Output
Consumption
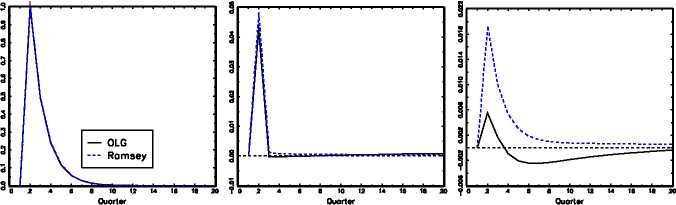
Real Interest Rate
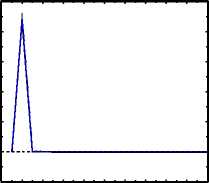
O 2 Л в β 10 U U le 18 20
Ouorlar
stock remains above its non-stochastic level for many quarters.
We conclude this section by a comparison of the time series properties of the OLG and
the Ramsey model. For this purpose we compute 100 simulations of 150 periods length
each17 and filter each simulated time series using the HP-filter with weight 1,600. The
time series moments reported in Table 2 are averages over the 100 simulations. The
technology shock and the growth shock are generated by the processes (14) and (18),
respectively. We use the same sequence of shocks for the OLG and the Ramsey model.
The first column in Table 2 presents the aggregate variable. In the second and fifth
column, the standard deviation of the respective variables are displayed. Columns 3 and
6 display the correlation with output, while columns 4 and 7 present the autocorrelation
of the variables in the two models, respectively.
17See, e.g., Cooley and Hansen (1995), p. 189.
23
More intriguing information
1. What Lessons for Economic Development Can We Draw from the Champagne Fairs?2. Self-Help Groups and Income Generation in the Informal Settlements of Nairobi
3. Apprenticeships in the UK: from the industrial-relation via market-led and social inclusion models
4. Learning-by-Exporting? Firm-Level Evidence for UK Manufacturing and Services Sectors
5. Delayed Manifestation of T ransurethral Syndrome as a Complication of T ransurethral Prostatic Resection
6. The name is absent
7. Visual Artists Between Cultural Demand and Economic Subsistence. Empirical Findings From Berlin.
8. The name is absent
9. ADJUSTMENT TO GLOBALISATION: A STUDY OF THE FOOTWEAR INDUSTRY IN EUROPE
10. The name is absent