Aggregate Wage Flexibility in Selected New EU Member States 9
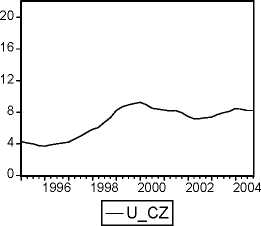
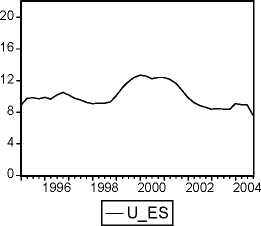
Figure 1: Unemployment Rates (% of labor force), 1995—2004, quarterly
CE-4
ERM-II
EMU
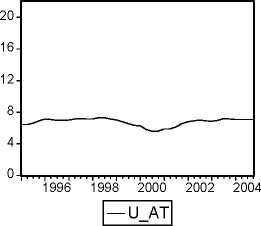
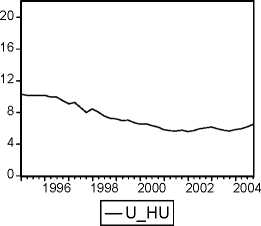
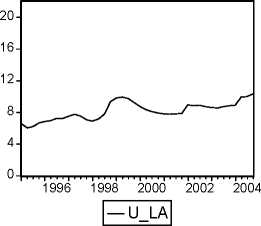
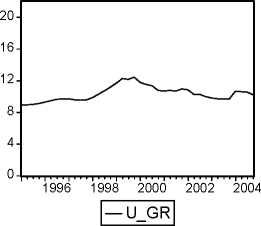
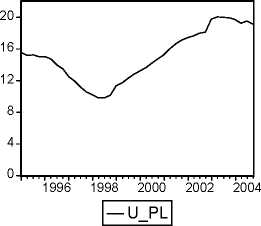
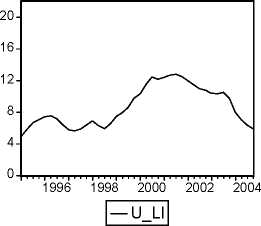
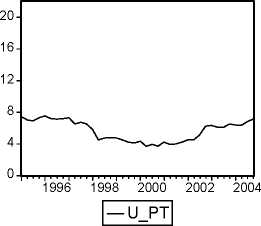
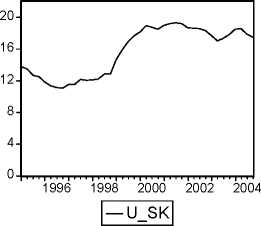
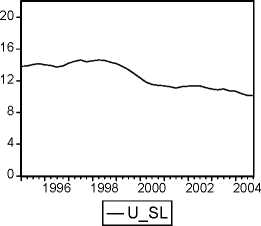
Table 1: Unemployment Rates (% of labor force), 1995—2004 averages
|
_________CE-4_________ |
________ERM-II |
____________EMU______ | |||
|
CZ |
6.8 |
ES |
10.0 |
AT |
6.7 |
|
HU |
7.3 |
LA |
8.2 |
GR |
10.3 |
|
PO |
15.0 |
LI |
8.7 |
PT |
5.6 |
|
SK |
15.7 |
SL |
12.6 | ||
|
Mean______ |
11.2 |
Mean______ |
9.8_____ |
Mean______ |
7.6 |
More intriguing information
1. Multimedia as a Cognitive Tool2. ARE VOLATILITY EXPECTATIONS CHARACTERIZED BY REGIME SHIFTS? EVIDENCE FROM IMPLIED VOLATILITY INDICES
3. Creating a 2000 IES-LFS Database in Stata
4. The name is absent
5. Ruptures in the probability scale. Calculation of ruptures’ values
6. Citizenship
7. The name is absent
8. A Study of Prospective Ophthalmology Residents’ Career Perceptions
9. The name is absent
10. The name is absent