Inflation Rate
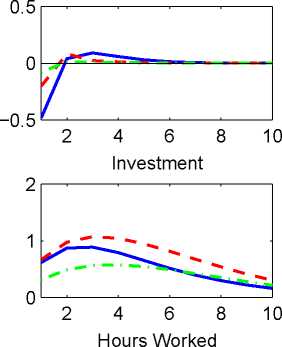
1
Output
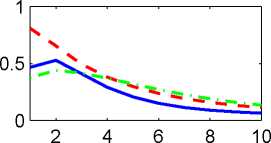
2
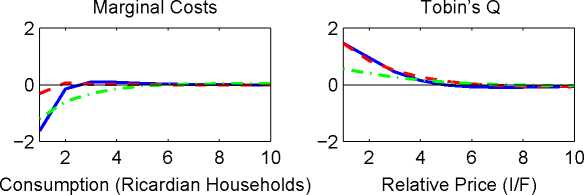
Consumption (Aggregate)
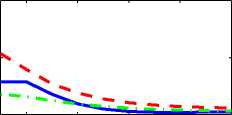
2 4 6 8 10
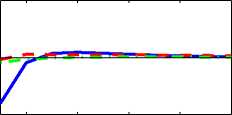
2 4 6 8 10
-1
Nominal Interest Rate
Real Wage
0
0.4
0.2
0
2 4 6 8 10
NK Model---NK Model with FA---2-sector NK Model
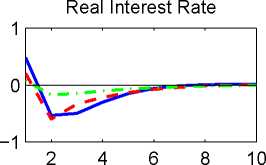
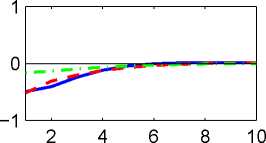
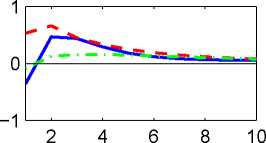
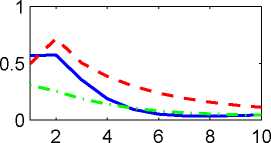
Figure 4: Estimated Impulse Responses to a Productivity Shock♦
♦ Each panel plots the mean response corresponding a positive one standard deviation shock.
Each response is for a 10 quarters (2.5 years) horizon. All DSGE impulse responses are computed
simulating the vector of DSGE model parameters at the posterior mean values reported in Table 3.
47
More intriguing information
1. FASTER TRAINING IN NONLINEAR ICA USING MISEP2. Strategic Investment and Market Integration
3. The name is absent
4. Synchronisation and Differentiation: Two Stages of Coordinative Structure
5. IMMIGRATION AND AGRICULTURAL LABOR POLICIES
6. Large Scale Studies in den deutschen Sozialwissenschaften:Stand und Perspektiven. Bericht über einen Workshop der Deutschen Forschungsgemeinschaft
7. A Review of Kuhnian and Lakatosian “Explanations” in Economics
8. Measuring and Testing Advertising-Induced Rotation in the Demand Curve
9. On the Desirability of Taxing Charitable Contributions
10. Review of “From Political Economy to Economics: Method, the Social and Historical Evolution of Economic Theory”