Autocorrelation of price
Figure 4 summarizes the market outcomes in each trading period. The endpoints of each
vertical line indicate maximum and minimum transaction prices, and the bar ‘ - ’ on the
right of each vertical line represents the final transaction. Autocorrelation between
current price and previous price within each period and market efficiency are shown
below the horizontal x-axis. The estimated autocorrelation of prices is significantly
negative in the early periods and becomes positive when traders gain experience in the
later periods. The autocorrelation of price dies out after period 6, however. This is
because traders gain more observations and change their beliefs less in response to new
bids and asks. It can also be owed to the heterogeneity of traders (Cason and Friedman
(1996)).
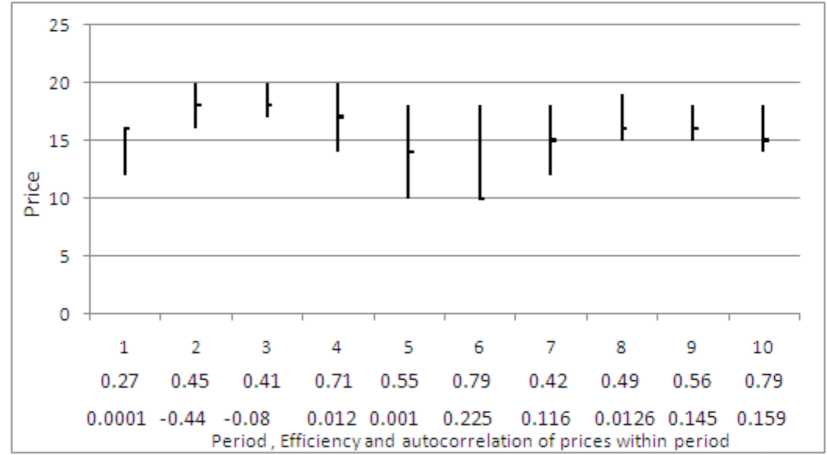
Figure 4: Formation of prices and efficiency levels across periods
5. Conclusion
This paper explores the potential of individual permit trading in traffic congestion during
peak hours. Regulators can determine congestion targets through deciding the number of
permits available in the market. The price of the permit is determined by the demand and
supply in the auction market. The price is allowed to fluctuate according to over-demand
at a particular time; higher demand in peak hours causes the permit price and the cost of
11
More intriguing information
1. A Location Game On Disjoint Circles2. LAND-USE EVALUATION OF KOCAELI UNIVERSITY MAIN CAMPUS AREA
3. Internationalization of Universities as Internationalization of Bildung
4. Economie de l’entrepreneur faits et théories (The economics of entrepreneur facts and theories)
5. The name is absent
6. Commitment devices, opportunity windows, and institution building in Central Asia
7. The name is absent
8. Wage mobility, Job mobility and Spatial mobility in the Portuguese economy
9. Convergence in TFP among Italian Regions - Panel Unit Roots with Heterogeneity and Cross Sectional Dependence
10. The name is absent