Figure 1: Theoretical demand and supply of permits
Sources of inefficiency
Allocative efficiency can fall short of 100% when (1) transactions are executed by extra-
marginal traders and (2) mutually profitable trades are not executed. For example, in
Figure 2, allocative efficiency predicts that trades occurred between the six highest value
buyers, namely B10, B13, B15, B27, B20 and B6, and the six lowest cost sellers, namely
S30, S2, S10, S13, S15 and S21.3 Extra-marginal trade occurs if lowest value buyers
manage to trade and mutually profitable trade is not executed if the six highest value
buyers do not buy from low cost sellers.
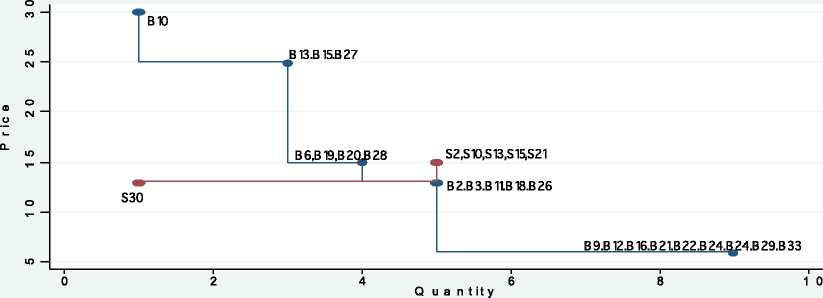
Figure 2: The demand (Value) and supply (Cost) in period 1
3
Allocative efficiency is 45 when buyers B10, B13, B15, B27, B20 and B6 bought from sellers S30, S2,
S10, S13, S15 and S21.
More intriguing information
1. Explaining Growth in Dutch Agriculture: Prices, Public R&D, and Technological Change2. Secondary school teachers’ attitudes towards and beliefs about ability grouping
3. AMINO ACIDS SEQUENCE ANALYSIS ON COLLAGEN
4. The name is absent
5. Experience, Innovation and Productivity - Empirical Evidence from Italy's Slowdown
6. Word Sense Disambiguation by Web Mining for Word Co-occurrence Probabilities
7. Evolution of cognitive function via redeployment of brain areas
8. The name is absent
9. The name is absent
10. The name is absent