Chart 6 Aggregate labour productivity
growth developments: Europe versus the
United States
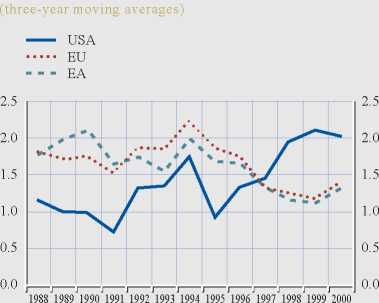
Sources: OECD, NCBs and ECB calculations.
- as well as from the high technology intensity
sector. Indeed, while in the 1980s the weight of
the high technology intensity manufacturing
sector was lower in the United States compared
with the EU, it turned higher at the end of the
1990s thanks to a much more rapid expansion of
the high technology intensity manufacturing
sector in the United States. The weight of the
high technology intensity sector in the EU has
even tended to decrease over the last 15 years.
Regarding business sector services, the main
difference has arisen from the wholesale and
retail trade, the output share of which is on
average 5-8 percentage points higher in the
United States than in the EU, depending on the
period.
As regards the differences in aggregate labour
productivity developments (see Table 3), the
EU has enjoyed a stronger increase over the
period 1985-2001 than the United States.
However, the comparison of long-run averages
hides the slowdown of labour productivity
increases in the EU and the euro area in the
second half of the 1990s compared with a
substantial pick-up of labour productivity
growth rates in the United States over the same
period (see Chart 6). This growing difference of
aggregate productivity developments between
the United States and the EU/euro area in the
second half of the 1990s is partly explained by a
stronger labour productivity performance in the
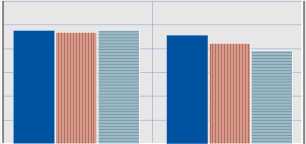
Chart 7 Lilien indicator for Europe and the
United States
Euro area
.......... EU
≡≡ USA
Total economy (excl. social community and personal services)
0.030
0.025
0.020
0.015
0.010
0.005
0.000
0.030
0.025
0.020
0.015
0.010
0.005
0.000
1985-1989 j 1996-2001
Manufacturing
0.030
0.025
0.020
0.015
0.010
0.005
0.000
0.030
0.025
0.020
0.015
0.010
0.005
0.000
■ ■
j 1985-1989 j 1996-2001
Utilities and business services
■ I
1985-1989 ʃ 1996-2001
0.030
0.025
0.020
0.015
0.010
0.005
0.000
0.030
0.025
0.020
0.015
0.010
0.005
0.000
Sources: OECD, NCBs and ECB calculations.
Note : The figures for the euro area and the EU refer to weighted
averages; they do not include Greece, Ireland and Luxembourg on
account of missing sectors.
wholesale and retail trade and financial
intermediation, two ICT-using services sectors
that - taken together - account for about 17% of
total gross value added in the euro area and
almost 27% of total gross value added in the
United States.37
Looking at the disaggregated level in
manufacturing and business sector services,
labour productivity growth in both sectors was
37 See B. van Ark, R. Inklaar, and R. H. McGuckin (2003), “ICT
and productivity in Europe and the United States. Where do the
differences come from?”, University of Groningen, mimeo and
European Commission (2003), The EU Economy: 2003 Review,
Brussels.
ECB
Occasional Paper No. 19
July 2004
More intriguing information
1. Benefits of travel time savings for freight transportation : beyond the costs2. Bargaining Power and Equilibrium Consumption
3. Insecure Property Rights and Growth: The Roles of Appropriation Costs, Wealth Effects, and Heterogeneity
4. The name is absent
5. The name is absent
6. Perfect Regular Equilibrium
7. Regulation of the Electricity Industry in Bolivia: Its Impact on Access to the Poor, Prices and Quality
8. The name is absent
9. A novel selective 11b-hydroxysteroid dehydrogenase type 1 inhibitor prevents human adipogenesis
10. The name is absent