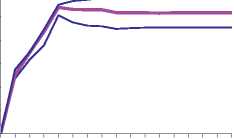
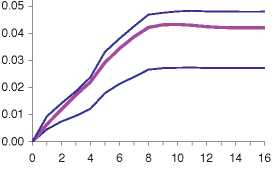
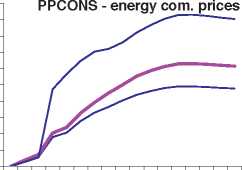
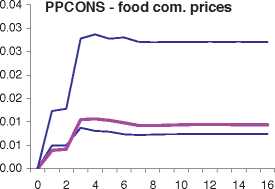
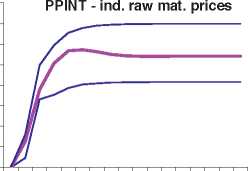
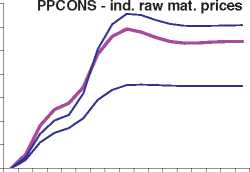
Chart 11. Each row shows the impact of one shocked variable (NEER, energy commodity
prices, food commodity prices and industrial raw material prices) on one component of either
PPI or the HICP.
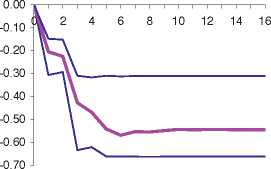
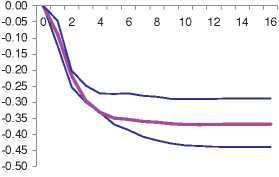
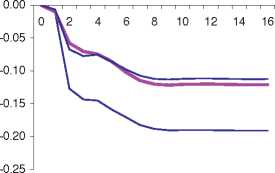
Chart 10 Confidence bands for producer prices
(deviation from baseline following 1% increase in effective exchange rate, energy
price or non-energy commodity prices)
PPENE - NEER
0.30 -
0.25 -
0.20 -
0.15 -
0.10 -
0.05 -
0.00 -
PPINT - NEER
PPCONS - NEER
0.020
0.018
0.016
0.014
0.012
0.010
0.008
0.006
0.004
0.002
0.000
0.35 -I PPENE - energy com. prices
0 2 4 6 8 10 12 14 16
0.06 -I PPINT - energy com. prices
0 2 4 6 8 10 12 14 16
0.04
0.03
0.03
0.02
0.02
0.01
0.01
0.00
0.16
0.14
0.12
0.10
0.08
0.06
0.04
0.02
0.00
0 2 4 6 8 10 12 14 16
0 2 4 6 8 10 12 14 16
PPENE: PPI energy; PPINT: PPI intermediate goods; PPCONS: PPI consumer goods; NEER: nominal effective
exchange rate of the euro.
ECB ■
Working Paper Series No 1104 E>ι
November 2009∣ 23
More intriguing information
1. The name is absent2. Großhandel: Steigende Umsätze und schwungvolle Investitionsdynamik
3. The name is absent
4. he Effect of Phosphorylation on the Electron Capture Dissociation of Peptide Ions
5. The name is absent
6. LABOR POLICY AND THE OVER-ALL ECONOMY
7. The Effects of Attendance on Academic Performance: Panel Data Evidence for Introductory Microeconomics
8. The name is absent
9. Wirtschaftslage und Reformprozesse in Estland, Lettland, und Litauen: Bericht 2001
10. The Role of Evidence in Establishing Trust in Repositories