about 0.06% after 16 quarters and stems from direct effects from energy and food commodity
prices and indirect effects from energy commodity prices via energy producer prices and from
industrial raw material prices via intermediate goods producer prices. The effect on consumer
prices is strongest for the component processed food (0.06% after 16 quarters), due to the
relatively strong effect of food commodity prices directly and indirectly. The impact on non-
energy industrial goods and services prices is 0.03% and 0.02% after 16 quarters,
respectively. Taking together the HICP components, the aggregate effect on the HICP
excluding unprocessed food and energy is about 0.03% after 16 quarters.
This larger impact of total commodity price changes compared with the impact of the energy
commodity price changes only (as used by most other studies) suggests that one would miss
significant variables in the determination of euro area producer and consumer prices when not
taking them into account.
Chart 9 Impact multiplier of all commodity prices
(deviation from baseline following 1% increase in all commodity prices)
Effect of 1% increase in all commodity
prices on producer prices
(deviation from baseline)
Effect of 1% increase in all commodity
prices on consumer prices
(deviation from baseline)
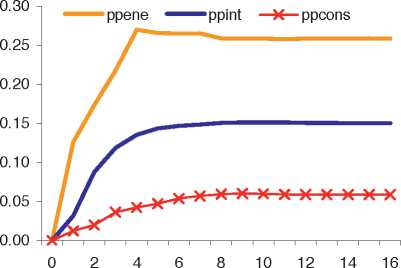
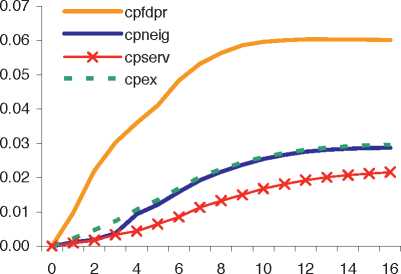
PPENE: PPI energy; PPINT: PPI intermediate goods; PPCONS: PPI consumer goods; CPFDPR: HICP
processed food; CPNEIG: HICP non-energy industrial goods; CPSERV: HICP services, CPEX: HICP excluding
unprocessed food and energy.
Again, we cross-check our results using input-output tables for the three PPI components and
for total consumer prices. Table 6 shows the share of imported inputs of each of the
commodities analysed above divided by the total output for each sector (first column), using
the same source as in Table 5. The second column shows the impact of a 1% increase in the
price of each of the commodities after 4 years, according to our estimation results.
Obviously, the share of imported energy commodities in total output of the energy sector is
highest (26%), while it much smaller for the other sectors. Food commodities appear to be an
ECB ■
Working Paper Series No 1104 EVI
November 2009∣ 21
More intriguing information
1. Strategic Effects and Incentives in Multi-issue Bargaining Games2. The name is absent
3. The name is absent
4. Inhimillinen pääoma ja palkat Suomessa: Paluu perusmalliin
5. The name is absent
6. From music student to professional: the process of transition
7. The name is absent
8. An Empirical Analysis of the Curvature Factor of the Term Structure of Interest Rates
9. Feature type effects in semantic memory: An event related potentials study
10. INSTITUTIONS AND PRICE TRANSMISSION IN THE VIETNAMESE HOG MARKET