Mean Efficiency
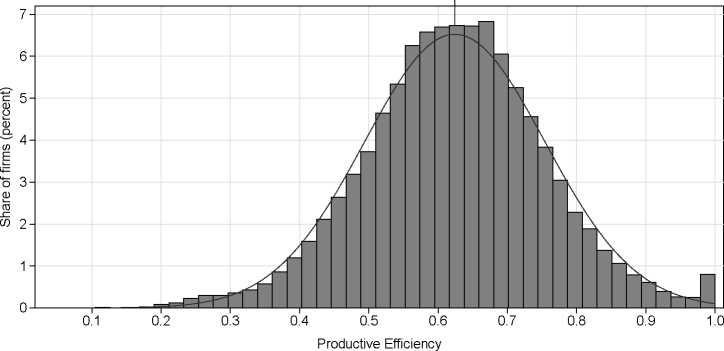
Figure 1: Histogram of efficiency at the micro level and normal density (38,641 observations)
3.4 Distribution of productive efficiency
Table 3 shows the parameters of the distribution of productive efficiency scores calculated ac-
cording to Equation (2). In general, the distribution of productive efficiency is centered and most
firms are clustered close to the mean (Figure 1). The peak seen in distribution at the maximum
level is because, by definition, at least one firm in each industry is fully efficient; that is, each
industry has a different max αjs used as the benchmark in Equation (2) for the other firms in
that industry. Symmetry as well as skewness of the distribution of productive efficiency largely
coincides with the normal distribution. This is reassuring as it confirms the appropriateness of
using OLS in the second step of the analysis.
4 Determinants of productive efficiency
4.1 Partial R2s and variables used in the second step of analysis
To analyze the determinants of productive efficiency, we relate the estimated productive effi-
ciencies to a number of explanatory variables. We employ analysis of covariance (ANCOVA),
where independent variables can be both metric and categorical, as the regression method. Since
Table 3: Distribution of productive efficiency
Variable N Mean CV p90 Q3 Median Q1 p10 min
Efficiency 38641 0.625 0209 0.785 0.707 0.624 0.542 0.461 0.041
Notes: p10 and p90 are the 10th and 90th percentiles; CV is the coefficient of variation; Q1 and Q3 are lower
and upper quantiles.
10
More intriguing information
1. Evolutionary Clustering in Indonesian Ethnic Textile Motifs2. How Low Business Tax Rates Attract Multinational Headquarters: Municipality-Level Evidence from Germany
3. PACKAGING: A KEY ELEMENT IN ADDED VALUE
4. ALTERNATIVE TRADE POLICIES
5. The voluntary welfare associations in Germany: An overview
6. BARRIERS TO EFFICIENCY AND THE PRIVATIZATION OF TOWNSHIP-VILLAGE ENTERPRISES
7. An Efficient Secure Multimodal Biometric Fusion Using Palmprint and Face Image
8. TOWARD CULTURAL ONCOLOGY: THE EVOLUTIONARY INFORMATION DYNAMICS OF CANCER
9. The name is absent
10. Review of “The Hesitant Hand: Taming Self-Interest in the History of Economic Ideas”