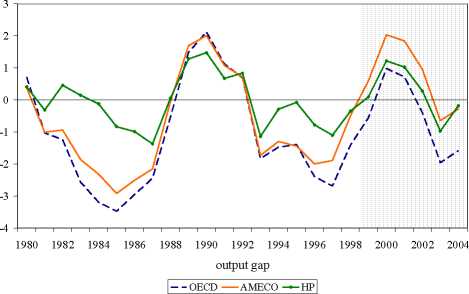
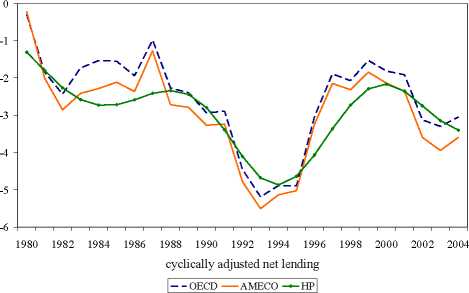
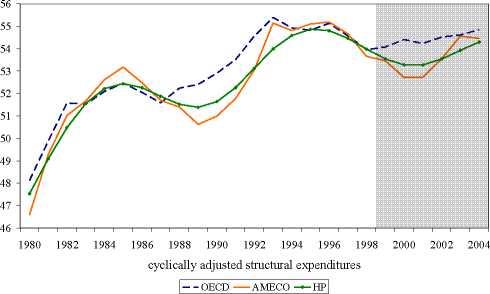
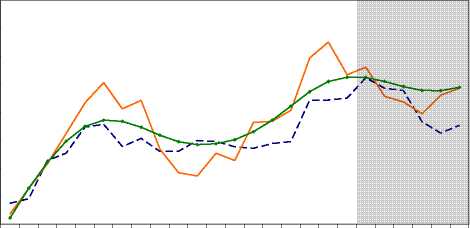
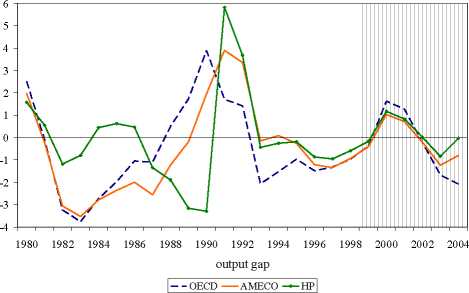
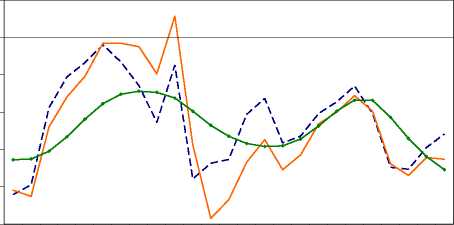
Figure 5.2 Output Gap, Cyclically Adjusted Net Lending, Spending and Revenue
(% of potential GDP)
France
% potential GDP% potential GDP % potential GDP% potential GDP
54
53
52
51
50
49
48
47
46
1980 1982 1984 1986 1988 1990 1992 1994 1996 1998 2000 2002 2004
cyclically adjusted structural revenues
- - OECD--AMECO -→-Hp
Germany
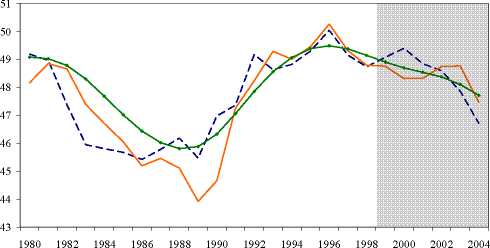
cyclically adjusted structural expenditures
1
0
-1
-2
-3
-4
-5
48
47
46
45
44
43
42
41
- - OECD AMECO -→-Hp

1980 1982 1984 1986 1988 1990 1992 1994 1996 1998 2000 2002 2004
cyclically adjusted net lending
- - OECD--AMECO — HP
1980 1982 1984 1986 1988 1990 1992 1994 1996 1998 2000 2002 2004
cyclically adjusted structural revenues
- -OECD AMECO -→-HP∣
124
More intriguing information
1. The effect of globalisation on industrial districts in Italy: evidence from the footwear sector2. The Impact of Cognitive versus Affective Aspects on Consumer Usage of Financial Service Delivery Channels
3. Globalization, Divergence and Stagnation
4. The name is absent
5. Optimal Taxation of Capital Income in Models with Endogenous Fertility
6. The name is absent
7. A Hybrid Neural Network and Virtual Reality System for Spatial Language Processing
8. Manufacturing Earnings and Cycles: New Evidence
9. Getting the practical teaching element right: A guide for literacy, numeracy and ESOL teacher educators
10. The name is absent