% potential GDP % potential GDP % potential GDP% potential GDP
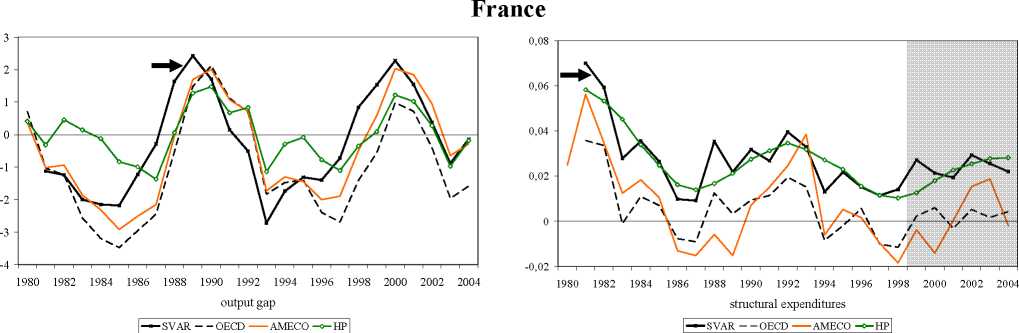
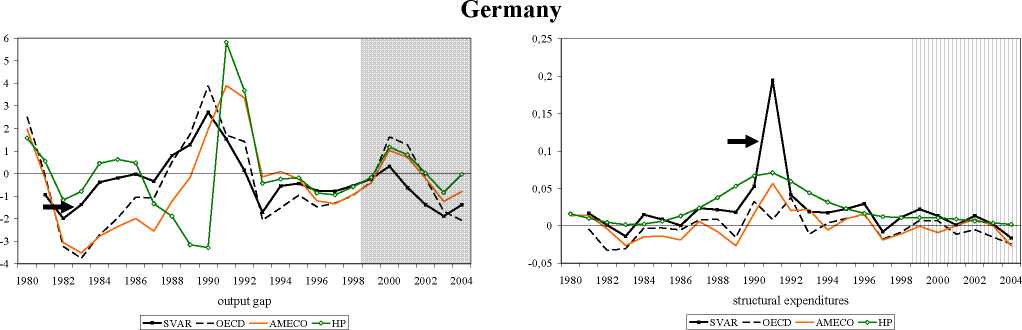
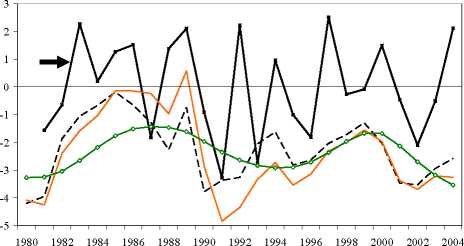
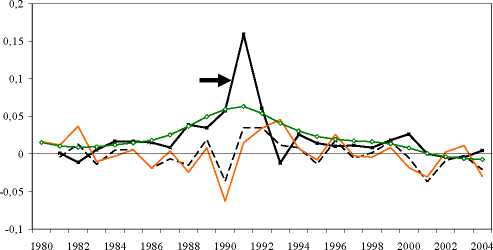
Figure 5.5 SVAR-indicator of Output Gap, Structural Net Lending, Expenditure and
Revenues (% potential GDP)*
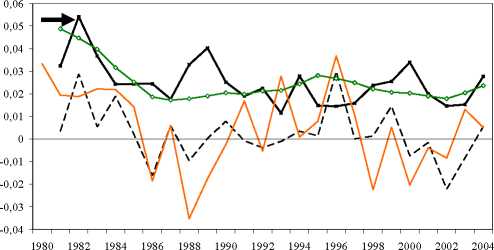
structural revenues
∣-SVAR--OECD--AMECO -Q-Hp
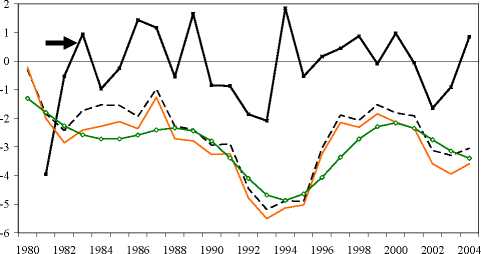
structural net lending
∣--SVAR - -OECD--AMECO -Q-Hp
structural revenues
-SVAR OECD--AMECO -Q-Hp
structural net lending
∣-SVAR OECD AMECO -Q-Hp
Note: * Indicated by arrows.
143
More intriguing information
1. Governance Control Mechanisms in Portuguese Agricultural Credit Cooperatives2. Inflation and Inflation Uncertainty in the Euro Area
3. Literary criticism as such can perhaps be called the art of rereading.
4. Housing Market in Malaga: An Application of the Hedonic Methodology
5. Spectral calibration of exponential Lévy Models [1]
6. The name is absent
7. National curriculum assessment: how to make it better
8. The Provisions on Geographical Indications in the TRIPS Agreement
9. Cyclical Changes in Short-Run Earnings Mobility in Canada, 1982-1996
10. Does Market Concentration Promote or Reduce New Product Introductions? Evidence from US Food Industry