Figure 9. Change in primary fiscal positions and intensity of labour market reforms
Panel A. Ranks of changes in primary fiscal positions1 over 1993-1997 and reform intensities over 1994-2004: OECD
Ranks of reform intensity over 1994-2004
30
28
26
24
22
20
18
16
14
12
10
8
6
4
2
0
0 2 4 6 8 10 12 14 16 18 20 22 24 26 28 30
Ranks of changes in primary fiscal balance between 1993 and 1997
CZE
ESP
♦ USA
♦ GRC
FRA
ISL
KOR
SVK
CHE
JPN
POL
♦ NZL
♦ LUX
CAN «
♦ NOR
GBR
PRT
• SWE
♦ AUS
♦ AUT
♦ IRE
ITA
♦ BEL
DEU
FIN
♦ NLD
DNK
(Spearman's rank) correlation coefficient: -0.01
Panel B. Ranks of changes in primary fiscal positions1 over 1993-1997 and reform intensities over 1994-2004: EU-15
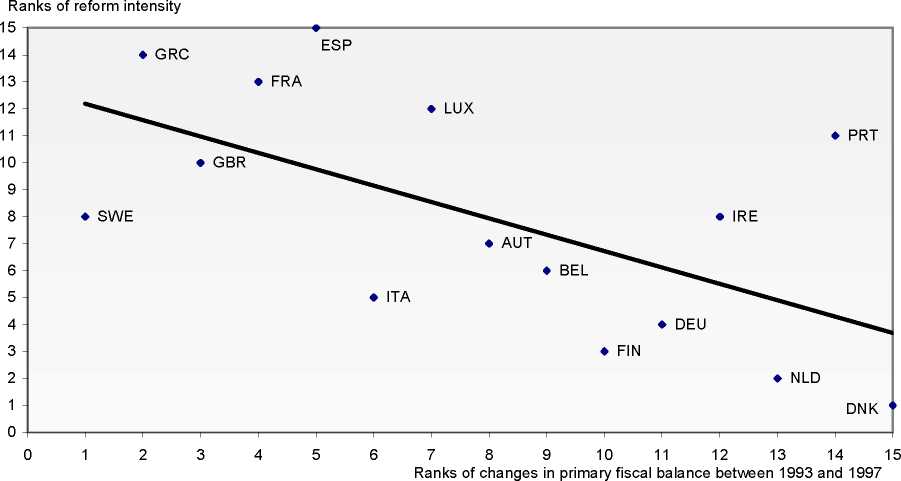
(Spearman's rank) correlation coefficient: -0.61 **
1. Rankings of changes in cyclically-adjusted primary fiscal surpluses between 1993 and 1997 (1995-1997 for Czech
Republic and Poland, 1994-1997 for Slovak Republic).
* significant at 10% level; ** significant at 5% level.
Source: Author's calculations.
186
More intriguing information
1. PEER-REVIEWED FINAL EDITED VERSION OF ARTICLE PRIOR TO PUBLICATION2. On the estimation of hospital cost: the approach
3. The name is absent
4. AN IMPROVED 2D OPTICAL FLOW SENSOR FOR MOTION SEGMENTATION
5. Industrial Employment Growth in Spanish Regions - the Role Played by Size, Innovation, and Spatial Aspects
6. BUSINESS SUCCESS: WHAT FACTORS REALLY MATTER?
7. Analyse des verbraucherorientierten Qualitätsurteils mittels assoziativer Verfahren am Beispiel von Schweinefleisch und Kartoffeln
8. Who’s afraid of critical race theory in education? a reply to Mike Cole’s ‘The color-line and the class struggle’
9. The name is absent
10. Real Exchange Rate Misalignment: Prelude to Crisis?