Real GDP growth
2.6
2.4
2.2
2
1.8
1.6
1.4
1.2
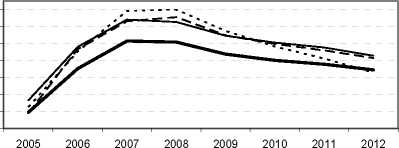
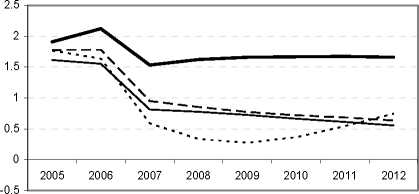
--------efficiency shock baseline
---participation shock.....Nairu fall
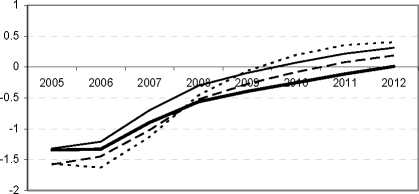
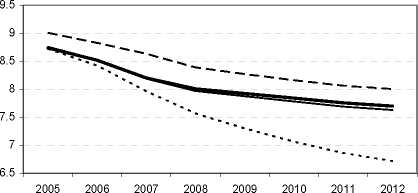
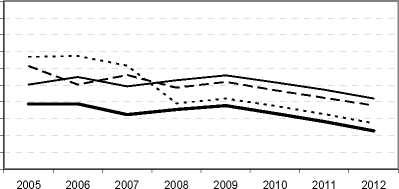
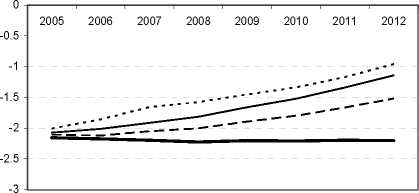
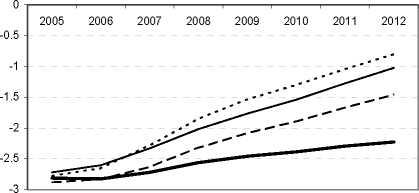
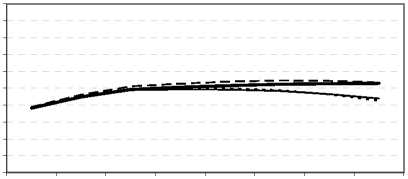
Figure 6. Simulated impact of various structured shocks in the euro area
Inflation
Output GAP
Unemployment rate
2.5
2.4
2.3
2.2
2.1
2
1.9
1.8
1.7
1.6
1.5
Potential output growth
Structural fiscal balance (% of GDP)
Fiscal balance (% of GDP)
70
68
66
64
62
60
58
56
54
52
50
Net government debt (% of GDP)
2005 2006 2007 2008 2009 2010 2011 2012
Note: The nature of the shocks is specified in the main text. Nominal exchange rate and real interest rates are kept
unchanged relative to baseline. Real government expenditure is also kept at baseline level.
Effects of a decline in structural unemployment
43. Also a decline in structural unemployment would raise the employment rate and potential output.
This is illustrated by a third simulation which reduces the structural unemployment gradually by
1 percentage point over the first three years. The increase in potential output is thus concentrated in these
years and the output gap widens initially by more than in the other simulations. This leads to a larger real
wage and inflation deceleration than in the other two simulations (Figure 6). This stimulates employment,
59
More intriguing information
1. Update to a program for saving a model fit as a dataset2. AN ECONOMIC EVALUATION OF COTTON AND PEANUT RESEARCH IN SOUTHEASTERN UNITED STATES
3. The name is absent
4. Wirkt eine Preisregulierung nur auf den Preis?: Anmerkungen zu den Wirkungen einer Preisregulierung auf das Werbevolumen
5. An Attempt to 2
6. The name is absent
7. Moffett and rhetoric
8. The name is absent
9. Globalization, Divergence and Stagnation
10. FOREIGN AGRICULTURAL SERVICE PROGRAMS AND FOREIGN RELATIONS