3500
3000 -
. 2500 -
φ 2000 -
E
О)
C
1 1500 -
Ω.
1000 -
500 -
0 4-
0
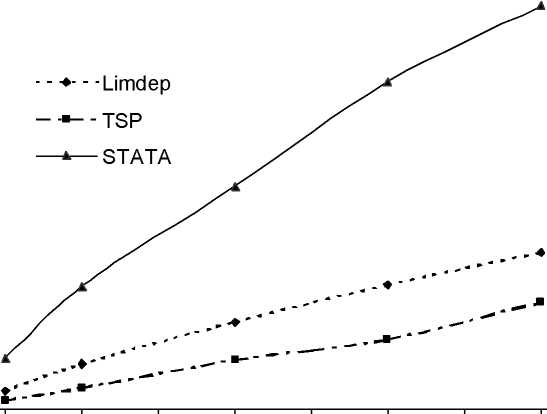
100 200 300 400 500 600 700 800 900
Number of replications
In order to have comparable results, the programs for the Monte Carlo experiments have been
written using the looping features made available by each package.
5.2 Bias and Monte Carlo Variability
The second and more important insight gained from the application of MCA1 is the evaluation of a
bias and a standard deviation for the Monte Carlo replications for each of the packages examined.
The following graphs show the behavior of the bias and the standard deviation around the Monte
Carlo mean computed for the coefficients of the Herfindahl concentration index and the normalized cost of
personnel:
14
More intriguing information
1. Valuing Farm Financial Information2. Synthesis and biological activity of α-galactosyl ceramide KRN7000 and galactosyl (α1→2) galactosyl ceramide
3. Contribution of Economics to Design of Sustainable Cattle Breeding Programs in Eastern Africa: A Choice Experiment Approach
4. The English Examining Boards: Their route from independence to government outsourcing agencies
5. Lumpy Investment, Sectoral Propagation, and Business Cycles
6. Inflation and Inflation Uncertainty in the Euro Area
7. The name is absent
8. Foreign direct investment in the Indian telecommunications sector
9. Estimating the Technology of Cognitive and Noncognitive Skill Formation
10. Discourse Patterns in First Language Use at Hcme and Second Language Learning at School: an Ethnographic Approach