
0.18
0.16 -
0.14 -
0.12 -
0.10 -
0.08 -
0.06 -
0.04 -
0.02 -
0.00
1955 1960 1965 1970 1975 1980 1985 1990 1995 2000
DFP J
0.025
0.0225
0.0200 -
0.0175 -
0.0150 -
0.0125 -
0.0100 -
0.0075 -
0.0050 -
0.0025
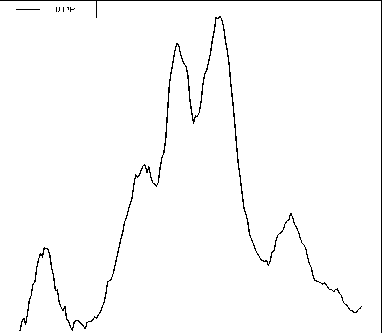
1955 1961 1967 1973 1979 1985 1991 1997
0.020 -
0.015 -
0.010 -
0.005 -
17
0.000
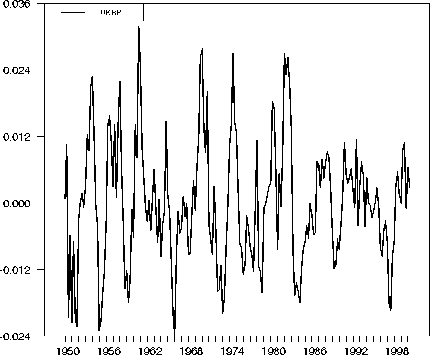
1950 1956 1962 1968 1974 1980 1986 1992 1998
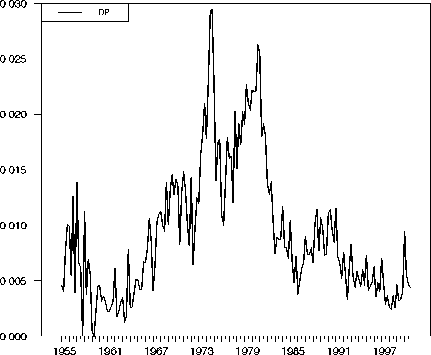
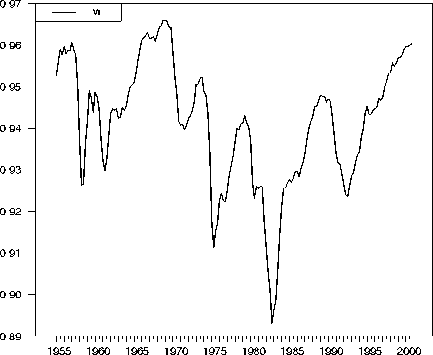
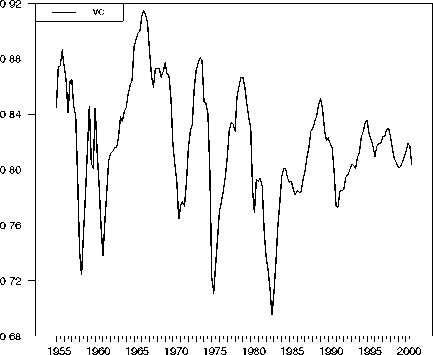
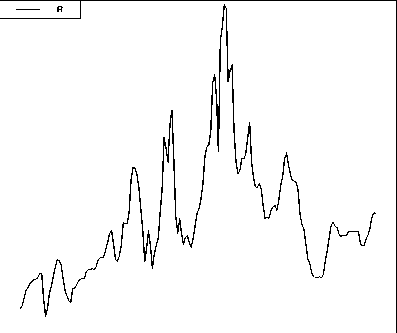
Figure 2: The fundamental data of the model.
More intriguing information
1. The name is absent2. The Complexity Era in Economics
3. An Estimated DSGE Model of the Indian Economy.
4. Concerns for Equity and the Optimal Co-Payments for Publicly Provided Health Care
5. The name is absent
6. Educational Inequalities Among School Leavers in Ireland 1979-1994
7. The name is absent
8. The name is absent
9. The use of formal education in Denmark 1980-1992
10. Legal Minimum Wages and the Wages of Formal and Informal Sector Workers in Costa Rica