0.8
0.6
0 1000 2000 3000 4000 5000
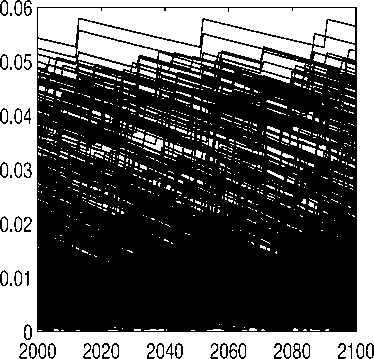
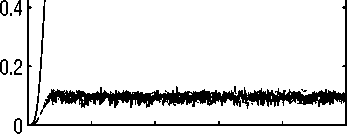
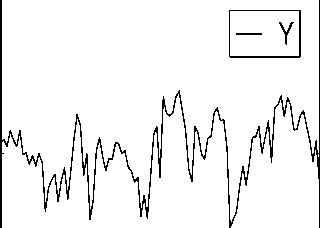
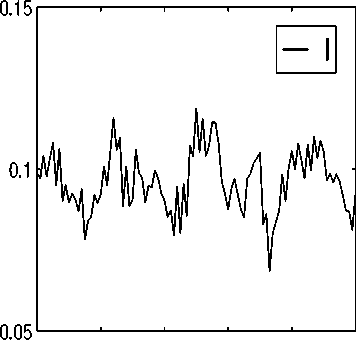
Figure 3: A simulation path of GDP and investment. X axis shows quarters. Y axis is
scaled by the stationary level GDP.
18
1.05
0.95------------'------------'------------'------------'------------
2000 2020 2040 2060 2080 2100
2000 2020 2040 2060 2080 2100
More intriguing information
1. Cross-Country Evidence on the Link between the Level of Infrastructure and Capital Inflows2. The name is absent
3. Innovation Trajectories in Honduras’ Coffee Value Chain. Public and Private Influence on the Use of New Knowledge and Technology among Coffee Growers
4. The name is absent
5. Novelty and Reinforcement Learning in the Value System of Developmental Robots
6. The name is absent
7. Healthy state, worried workers: North Carolina in the world economy
8. Ronald Patterson, Violinist; Brooks Smith, Pianist
9. The name is absent
10. Tax Increment Financing for Optimal Open Space Preservation: an Economic Inquiry