140
200
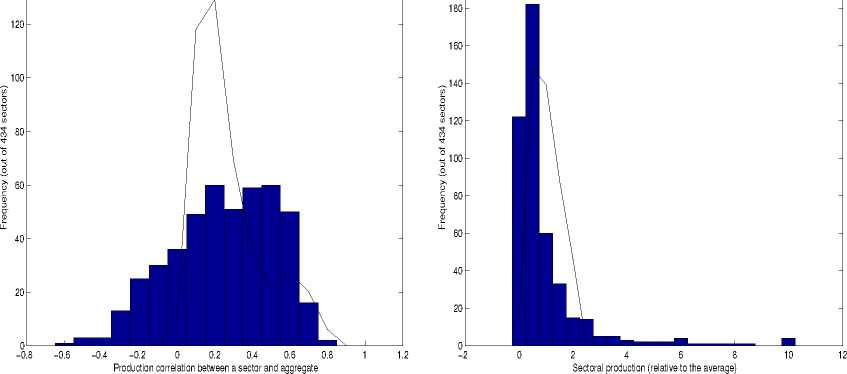
Figure 5: Correlation between sectoral and aggregate production (left) and cross sec-
tional distribution of production relative to average (right). The bar and line respec-
tively show the actual data and simulation.
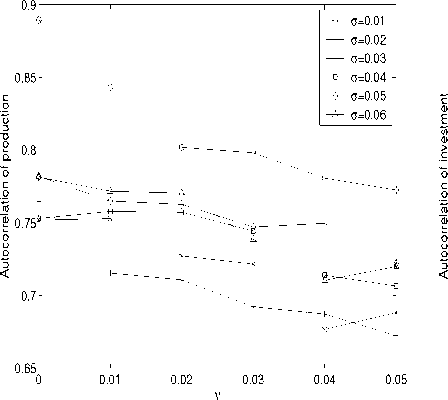
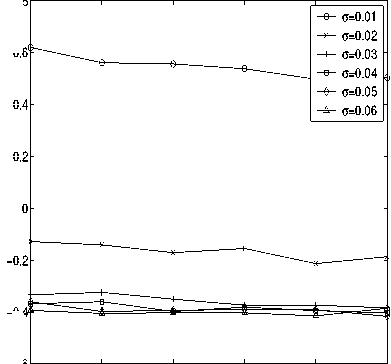
Figure 6: Autocorrelation of GDP (left) and investment (right)
0.8
0.6
0.4
0.2
0.2
-0.4
0.01
0
0.02
0.03
0.04
0.05
ν
-0.6
21
More intriguing information
1. Income Taxation when Markets are Incomplete2. ‘I’m so much more myself now, coming back to work’ - working class mothers, paid work and childcare.
3. Integration, Regional Specialization and Growth Differentials in EU Acceding Countries: Evidence from Hungary
4. The WTO and the Cartagena Protocol: International Policy Coordination or Conflict?
5. A Computational Model of Children's Semantic Memory
6. The Social Context as a Determinant of Teacher Motivational Strategies in Physical Education
7. Alzheimer’s Disease and Herpes Simplex Encephalitis
8. Does Presenting Patients’ BMI Increase Documentation of Obesity?
9. Trade Liberalization, Firm Performance and Labour Market Outcomes in the Developing World: What Can We Learn from Micro-LevelData?
10. Visual Artists Between Cultural Demand and Economic Subsistence. Empirical Findings From Berlin.