US-Ger
US-UK
US-Japan
s
q
ρ
y
*
y
i
i*
i - i*
US/UK s
years
US/JP s

1 2 3 4 5
years
USjUIK q
US/GE q
0.51------------'------------'--------
1.50 1 2 3 4 5
years


0 1 2 3 4 5
years
US i

.10 1 2 3 4 5
years


USJP q
1 2 3 4 5
years
US/UK ρ0,k

20 1 2 3 4 5

years
0.
0.
û. -0.
-0.
-0.

years


US/UK i-*
0.
0.
0.
-0.

years

US i

.10 1 2 3 4 5
years

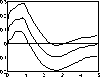
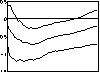
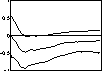
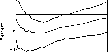
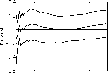
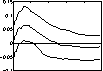
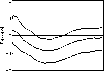
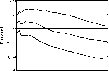
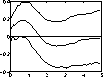
Figure 13: This figure shows impulse responses to a US monetary policy
contraction for the BIG VAR, using K = 11.
46
More intriguing information
1. The name is absent2. CONSUMER ACCEPTANCE OF GENETICALLY MODIFIED FOODS
3. The name is absent
4. Performance - Complexity Comparison of Receivers for a LTE MIMO–OFDM System
5. Cross-Country Evidence on the Link between the Level of Infrastructure and Capital Inflows
6. The name is absent
7. Skills, Partnerships and Tenancy in Sri Lankan Rice Farms
8. The name is absent
9. Fiscal Policy Rules in Practice
10. NATIONAL PERSPECTIVE