12
1 Stable distributions
Sample of size N=10^4
200 400 600 800 1000
Order statistics
50000
100000
Order statistics
Order statistics
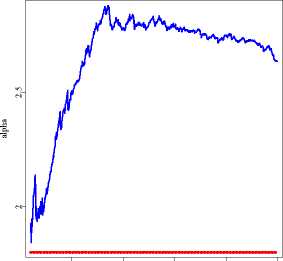
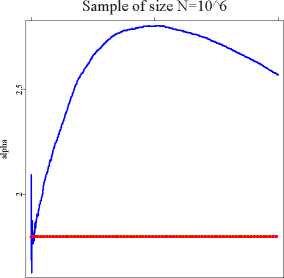
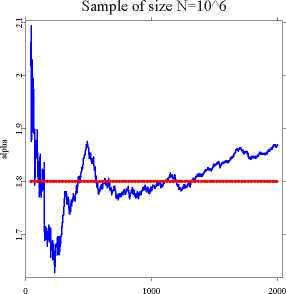
Figure 1.5: Plots of the Hill statistics <^n,k vs. the maximum order statistic
k for 1.8-stable samples of size N = 104 (top panel) and N = 106
(left and right panels). Red horizontal lines represent the true value
of α. For better exposition, the right panel is a magnification of
the left panel for small k. A close estimate is obtained only for
k = 500,..., 1300 (i.e. for k < 0.13% of sample size).
θ STFstab05.xpl
More intriguing information
1. Heterogeneity of Investors and Asset Pricing in a Risk-Value World2. Tastes, castes, and culture: The influence of society on preferences
3. Co-ordinating European sectoral policies against the background of European Spatial Development
4. The name is absent
5. The name is absent
6. The name is absent
7. Towards Learning Affective Body Gesture
8. The purpose of this paper is to report on the 2008 inaugural Equal Opportunities Conference held at the University of East Anglia, Norwich
9. Revisiting The Bell Curve Debate Regarding the Effects of Cognitive Ability on Wages
10. Transport system as an element of sustainable economic growth in the tourist region