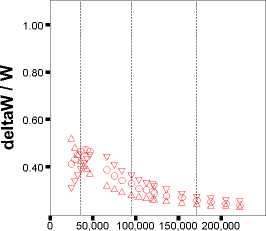
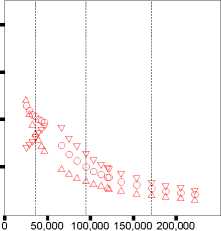
Figure 5: Welfare Losses, ∆W0 / W0, for U.S. (SCF) Data; Gender = 0 (male),
γ = 2, δ = 0.95, 0.97, or 0.99, Age = 50, Education = Middle *
delta = 0.95
Net worth
delta = 0.97
0 50,000 100,000 150,000 200,000
Net worth
delta = 0.99
Net worth
Noncapital Income
B 20,000
A 36,000
C 49,000
* Dotted vertical lines indicate age-specific quantiles for Net worth (25%, 50% and 75%); age-specific
quantiles for Labor Income are labeled by △ (25%), O (50%) and V (75%).
48
More intriguing information
1. The Shepherd Sinfonia2. The Triangular Relationship between the Commission, NRAs and National Courts Revisited
3. Forecasting Financial Crises and Contagion in Asia using Dynamic Factor Analysis
4. REVITALIZING FAMILY FARM AGRICULTURE
5. Spectral density bandwith choice and prewightening in the estimation of heteroskadasticity and autocorrelation consistent covariance matrices in panel data models
6. The name is absent
7. An Efficient Circulant MIMO Equalizer for CDMA Downlink: Algorithm and VLSI Architecture
8. The name is absent
9. Auctions in an outcome-based payment scheme to reward ecological services in agriculture – Conception, implementation and results
10. The name is absent