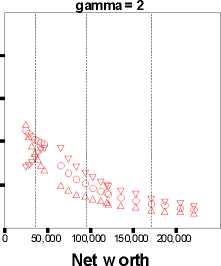
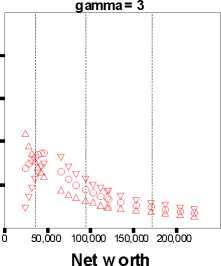
Figure 4: Welfare Losses, ∆W0 / W0, for U.S. (SCF) Data; Gender = 0 (male),
γ = 1, 2, or 3, δ = 0.97, Age = 50, Education = Middle *
gamma = 1
A
C
A
C
g
—«
I
*J
φ
■О
1. 00
0. 80
0. 60
0. 40
0 50,000 100,000 150,000 200,000
B
B
B
BB
C
C
AC
AC
A
BBB
C
AACAC
BB
AAC
A
BB
Net w orth
Noncapital Income
B 20,000
A 36,000
C 49,000
* Dotted vertical lines indicate age-specific quantiles for Net worth (25%, 50% and 75%); age-specific
quantiles for Labor Income are labeled by △ (25%), O (50%) and V (75%).
47
More intriguing information
1. Økonomisk teorihistorie - Overflødig information eller brugbar ballast?2. A Rare Case Of Fallopian Tube Cancer
3. Synchronisation and Differentiation: Two Stages of Coordinative Structure
4. Connectionism, Analogicity and Mental Content
5. The name is absent
6. The name is absent
7. The name is absent
8. The name is absent
9. Corporate Taxation and Multinational Activity
10. The name is absent