Graphical Data Representation in Bankruptcy Analysis
Probability of Default
-200 -150 -100 -50 0 50
Operating profit margin (K2)
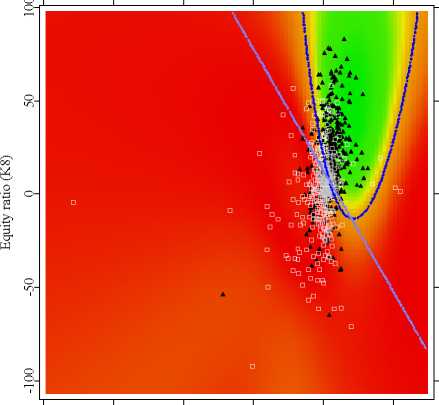
Fig. 1. A classification example. The boundary between the classes of solvent and
insolvent companies was estimated using DA and logit regression (two indistinguish-
able linear boundaries) and an SVM (a non-linear boundary).
One-year Cumulative Probability of Default (Bundesbank Data)
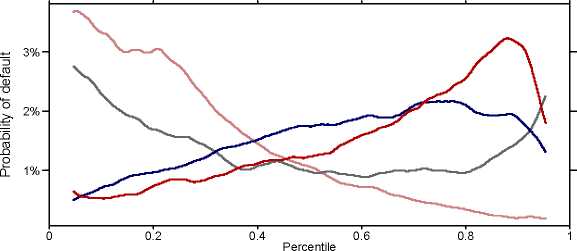
Fig. 2. One year cumulative PDs evaluated for several financial ratios on the Ger-
man Bundesbank data. The ratios are net income change, K21 (gray), net interest
ratio, K24 (red), interest coverage ratio, K29 (pink) and logarithm of total assets,
K33 (blue). The k-nearest-neighbours procedure was used with the size of the win-
dow being around 8% of all observations. The total number of observations is 553500.
More intriguing information
1. The name is absent2. Learning-by-Exporting? Firm-Level Evidence for UK Manufacturing and Services Sectors
3. AMINO ACIDS SEQUENCE ANALYSIS ON COLLAGEN
4. The name is absent
5. Name Strategy: Its Existence and Implications
6. Spectral calibration of exponential Lévy Models [1]
7. A Duality Approach to Testing the Economic Behaviour of Dairy-Marketing Co-operatives: The Case of Ireland
8. Creating a 2000 IES-LFS Database in Stata
9. Eigentumsrechtliche Dezentralisierung und institutioneller Wettbewerb
10. Direct observations of the kinetics of migrating T-cells suggest active retention by endothelial cells with continual bidirectional migration