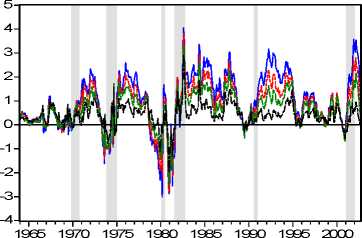
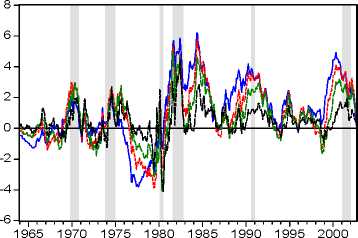
spr (60,3) spr (24,3)
spr (36,3)-----spr (12,3)
tp (60,3) tp (24,3)
tp (36,3)-----tp (12,3)
Figure 2
All the time series are covariance stationary. The results of both the Augmented Dickey-Fuller
(ADF), the Kwiatkowski-Phillips-Schmidt-Shin (KPSS), and the Phillips-Perron (PP) tests are
reported in Table 2. The top panel of the table reports the probability values of the ADF test. In the
central panel the LM statistics values of the KPSS test are displayed. In the bottom panel we
provide the results of the Phillips-Perron test. Both the ADF and the Phillips-Perron tests lead to the
rejection of the unit root hypothesis; while, the null hypothesis of stationarity cannot be rejected by
the KPSS test7.
|
. sample jan64-sep02 . |
long term maturity ( n ) | ||||||
|
obs 465___________ |
6 |
12 |
24 |
36 |
60 |
120 | |
|
spread |
ADF |
(0.000)* |
(0.000)* |
(0.000)* |
(0.003)* |
(0.011)* |
(0.017)* |
|
thspr |
ADF |
(0.000)* |
(0.001)* |
(0.001)* |
(0.002)* |
(0.001) |
(0.017) |
|
_tP________ |
ADF |
(0.000)* |
(0.000)* |
(0.000)* |
(0.001)* |
(0.006) |
(0.108) |
|
spread |
KPSS |
0.661* |
0.087* |
0.374* |
0.449* |
0.532* |
0.624* |
|
thspr |
KPSS |
0.152* |
0.182* |
0.243* |
0.318* |
0.477* |
0.206** |
|
tp________ |
KPSS |
0.079* |
0.217* |
0.490* |
0.672* |
0.143** |
0.208**a |
|
spread |
PP |
(0.000)* |
(0.000)* |
(0.000)* |
(0.000)* |
(0.001)* |
(0.003)* |
|
thspr |
PP |
(0.000)* |
(0.000)* |
(0.000)* |
(0.004)* |
(0.002) |
(0.012) |
|
_tp________ |
PP |
(0.000)* |
(0.000)* |
(0.003)* |
(0.023)* |
(0.030) |
(0.084)b |
The short term maturity is always m = 3 months. Exogenuos: *Intercept, **Intercept and
Trend; a18 lags; estimated with fixed spectral autoregressive least squares.
Table 2
7 To match the monthly frequency of data, the rule of thumb selected number of lags in the auxiliary regression is 12.
The automatic lag selection based on different criteria (Akaike, Schwarz, Hannan-Quinn) is roughly consistent with our
choice. Unit root test results obtained with the automatic lag selections are similar. The KPSS critical values are 0.739
(1%), 0.463 (5%), and 0.347 (10%) when the intercept is included in the model. Only in one case (120, 3) we laso
include the time trend in the KPSS auxiliary regression. The KPSS test critical values if also the trend is added are
0.216, 0.146, and 0.119 at 1%, 5%, and 10% significance levels respectively.
More intriguing information
1. Multimedia as a Cognitive Tool2. Auction Design without Commitment
3. Fortschritte bei der Exportorientierung von Dienstleistungsunternehmen
4. Fiscal Policy Rules in Practice
5. The Provisions on Geographical Indications in the TRIPS Agreement
6. Direct observations of the kinetics of migrating T-cells suggest active retention by endothelial cells with continual bidirectional migration
7. The name is absent
8. Trade Openness and Volatility
9. The Veblen-Gerschenkron Effect of FDI in Mezzogiorno and East Germany
10. The name is absent