Figures
Figures 1 to 3 depict in the upper graph the shares of claims bought by
the three investors in equilibrium for different levels of aggregate supply
of claims, X. The fat (thin) curve in the lower graph depicts the implied
(approximated) aggregate RRA with respect to X. (γ) denotes the assumed
vector of the constant RRA of the three investors, (1 /λ) denotes the vector
of weights attached to these investors by the social planner.
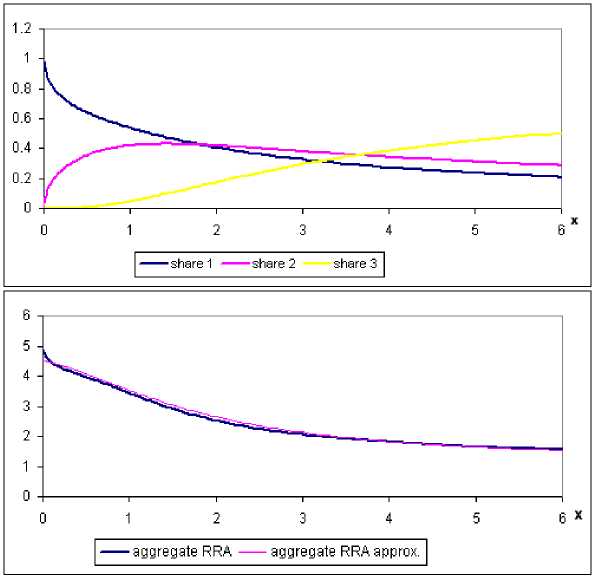
Figure 1: (γ) = (5; 3; 1) and 1 /λ = (1; 3/5; 1)
29
More intriguing information
1. Dendritic Inhibition Enhances Neural Coding Properties2. The name is absent
3. Behaviour-based Knowledge Systems: An Epigenetic Path from Behaviour to Knowledge
4. Innovation Policy and the Economy, Volume 11
5. DISCRIMINATORY APPROACH TO AUDITORY STIMULI IN GUINEA FOWL (NUMIDA MELEAGRIS) AFTER HYPERSTRIATAL∕HIPPOCAMP- AL BRAIN DAMAGE
6. Testing the Information Matrix Equality with Robust Estimators
7. Qualification-Mismatch and Long-Term Unemployment in a Growth-Matching Model
8. Why Managers Hold Shares of Their Firms: An Empirical Analysis
9. Moffett and rhetoric
10. Large Scale Studies in den deutschen Sozialwissenschaften:Stand und Perspektiven. Bericht über einen Workshop der Deutschen Forschungsgemeinschaft