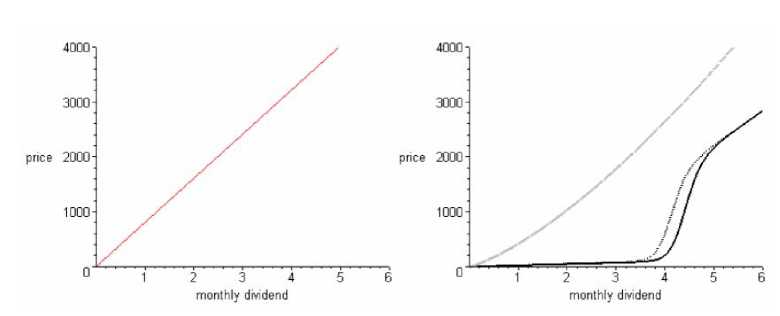
Figure 4: Asset price as a function of the concurrent monthly div-
idend.
The figure shows for four different specifications the asset price as a function of
the concurrent monthly dividend. The first graph (left) shows the benchmark case
of constant aggregate RRA. The other graph shows the asset prices for declining
aggregate RRA as shown in Specification 1 (gray line), Specification 2 (black line)
and Specification 3 (dotted line)(Figure 1-3).
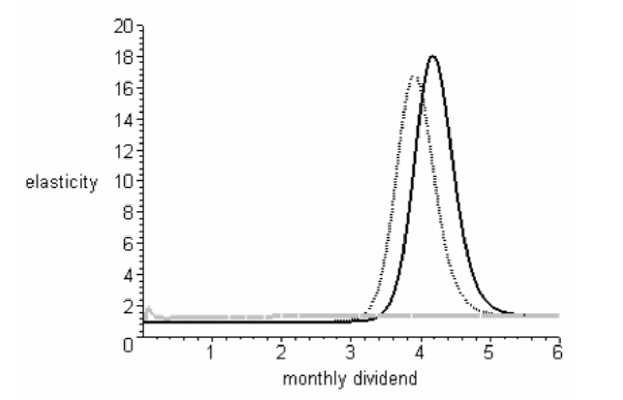
Figure 5: Elasticity of the asset price with respect to the concurrent
monthly dividend.
The figure shows the elasticity of the asset price with respect to the concurrent
monthly dividend for declining aggregate RRA as shown in Specification 1 (gray
line), Specification 2 (black line) and Specification 3 (dotted line) (Figure 1-3).
The benchmark case of constant aggregate RRA (not shown in the figure) yields a
constant elasticity of 1.
31
More intriguing information
1. The name is absent2. A Pure Test for the Elasticity of Yield Spreads
3. On Social and Market Sanctions in Deterring non Compliance in Pollution Standards
4. TOMOGRAPHIC IMAGE RECONSTRUCTION OF FAN-BEAM PROJECTIONS WITH EQUIDISTANT DETECTORS USING PARTIALLY CONNECTED NEURAL NETWORKS
5. Sex-gender-sexuality: how sex, gender, and sexuality constellations are constituted in secondary schools
6. Evidence of coevolution in multi-objective evolutionary algorithms
7. The name is absent
8. Parallel and overlapping Human Immunodeficiency Virus, Hepatitis B and C virus Infections among pregnant women in the Federal Capital Territory, Abuja, Nigeria
9. Income Growth and Mobility of Rural Households in Kenya: Role of Education and Historical Patterns in Poverty Reduction
10. The name is absent