Risk
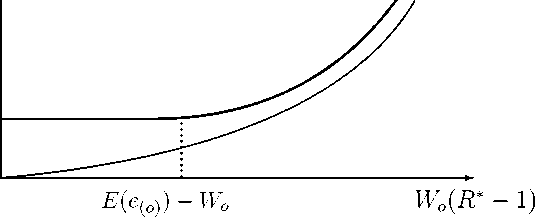
Fig.l The risk-value efficient frontier depicts the minimal portfolio risk as a func-
tion of the required expected portfolio return R*. The thin curve represents
the frontier for an endogenous benchmark, the thick curve for an exogenous
benchmark.
3.2 Risk-Value Models With an Exogenous Benchmark
Now consider risk functions with an exogenous benchmark e; e ≥0. Then in
the first order condition (8) for a risk-value efficient portfolio the second term
disappears since portfolio choice has no effect on the benchmark. Hence the
first order condition reads:
-f (⅛) = ηπ, + A; Vε.
(l2)
Again, A > 0 so that η < 0 follows.
Taking expectations yields
-E [f (e)] = η + A (l3)
so that subtraction of (l2) from (l3) leads to
-E[f (e)] + f (eε) = ηθε; V ε. (l4)
l5
More intriguing information
1. The Value of Cultural Heritage Sites in Armenia: Evidence From a Travel Cost Method Study2. CROSS-COMMODITY PERSPECTIVE ON CONTRACTING: EVIDENCE FROM MISSISSIPPI
3. What Lessons for Economic Development Can We Draw from the Champagne Fairs?
4. A COMPARATIVE STUDY OF ALTERNATIVE ECONOMETRIC PACKAGES: AN APPLICATION TO ITALIAN DEPOSIT INTEREST RATES
5. A Rational Analysis of Alternating Search and Reflection Strategies in Problem Solving
6. The name is absent
7. The name is absent
8. ISO 9000 -- A MARKETING TOOL FOR U.S. AGRIBUSINESS
9. ‘Goodwill is not enough’
10. PRIORITIES IN THE CHANGING WORLD OF AGRICULTURE