PROVIDE Project Technical Paper 2005:1
February 2005
Figure 4: Relative income sources by income deciles
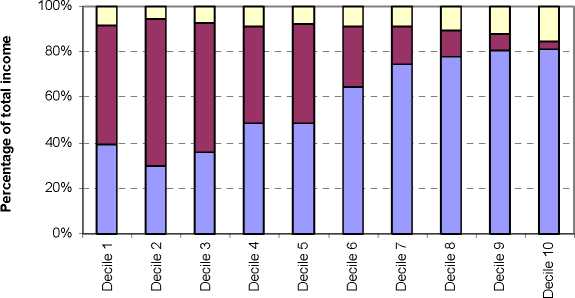
□ Corporations and GOS
□ Transfers (government and households)
□ Labour and home production
Note: Analytic weights assumed (variable weight)
Figure 5 graphs the food budget share by expenditure deciles. The expenditure deciles are
based on adult equivalent per capita expenditure levels (see footnote 31). The food budget
share stays the same between deciles one and two, and thereafter food becomes a normal
good as the food budget share declines. In general the pattern of food expenditure is in line
with expectations.
Figure 5: Food budget share by expenditure deciles using adult equivalent scales

Note: Analytic weights assumed (variable weight)
Previously it was shown that the average national tax rate as reported in the IES 2000 is
significantly lower than that of the SARB 2000. By looking at the average reported tax rates
within deciles it can be established whether (1) the pattern of tax expenditure is consistent
with increasing household income levels, and (2) the extent of the underreporting. Using
SARB 2000 data and the tax expenditure pattern of IES 2000, the ‘expected tax rate’ was
24
© PROVIDE Project
More intriguing information
1. POWER LAW SIGNATURE IN INDONESIAN LEGISLATIVE ELECTION 1999-20042. Placentophagia in Nonpregnant Nulliparous Mice: A Genetic Investigation1
3. The name is absent
4. The name is absent
5. Developments and Development Directions of Electronic Trade Platforms in US and European Agri-Food Markets: Impact on Sector Organization
6. The name is absent
7. The name is absent
8. The name is absent
9. An Empirical Analysis of the Curvature Factor of the Term Structure of Interest Rates
10. Campanile Orchestra