PROVIDE Project Technical Paper 2005:1
February 2005
Figure 6: Average tax rates by expenditure deciles

—♦—Tax rate (IES 2000, pre-adjustment)
—■—Expected tax rate (SARB 2000)
T Tax rate (IES 2000, post-adjustment)
Note: Analytic weights assumed (variable weight)
Finally, savings rates by expenditure decile are analysed. As shown in Figure 7 the
savings rate increases exponentially as we move along the income scale. The highest income
group contributes 74% to the pool of savings.
Figure 7: Savings rate by expenditure deciles
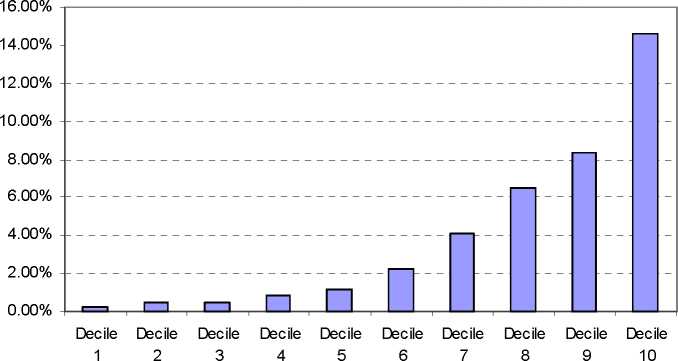
Note: Analytic weights assumed (variable weight)
3. Stata do-files to extract and reorganise data (ies2000.do)
A series of do-files were created to automate the process of extracting data, merging files,
creating variables and making the necessary changes to variables. The discussion below
describes in detail the functions of each do-file. Figure 8 and Figure 9 summarise the
discussion and also show how the do-files are structured. The master do-file, ies2000.do, calls
27
© PROVIDE Project
More intriguing information
1. Recognizability of Individual Creative Style Within and Across Domains: Preliminary Studies2. Before and After the Hartz Reforms: The Performance of Active Labour Market Policy in Germany
3. A Study of Adult 'Non-Singers' In Newfoundland
4. Conditions for learning: partnerships for engaging secondary pupils with contemporary art.
5. Migrating Football Players, Transfer Fees and Migration Controls
6. The name is absent
7. ANTI-COMPETITIVE FINANCIAL CONTRACTING: THE DESIGN OF FINANCIAL CLAIMS.
8. Personal Income Tax Elasticity in Turkey: 1975-2005
9. Globalization, Redistribution, and the Composition of Public Education Expenditures
10. The name is absent