Stata Technical Bulletin
Bishop, Y. M. M., S. E. Fienberg, and P. W. Holland. 1975. Discrete Multivariate Analysis. Cambridge, MA: MIT Press.
Gilbert, N. 1993. Analyzing tabular data: loglinear and logistic models for social researchers. London: UCL Press.
Haberman, S. J. 1973. The analysis of residuals in cross-classified tables. Biometrics 29: 205-220.
Judson, D. H. 1992a. smv5: Performing loglinear analysis of cross-classifications. Stata Technical Bulletin 6: 7-17.
——. 1992b. smv5.1: Loglinear analysis of cross-classifications, update. Stata Technical Bulletin 8: 18.
Tivers, J. 1985. Women Attached: The Daily Lives of Women with Young Children. Beckenham, UK: Croom Helm.
sg58 Mountain plots
Richard Goldstein, Qualitas, Inc., [email protected]
There are numerous options, both in Stata and in the literature, for graphically displaying univariate distributions. Examples
in Stata include box plots, probability plots, histograms, stem-and-leaf plots, etc. One family of such plots display the empirical
distribution function (EDF). The mountain plot presented here is a member of this family.
In effect, a mountain plot is a folded EDF curve (Monti 1995). A mountain plot for the price variable from Stata’s
auto.dta dataset is shown in Figure 1.
. mountain price
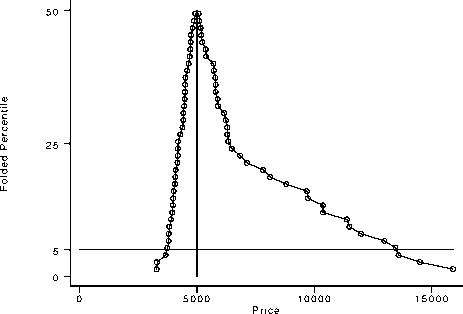
Monti's Mountain Plot
Figure 1
Monti points out that by examining such a plot it is easy to perform the following:
1. Determine the median.
2. Determine the range.
3. Determine the central or tail percentiles of any magnitude.
4. Observe outliers.
5. Observe unusual gaps in the data.
6. Examine the data for symmetry.
7. Compare several distributions.
8. Visually gauge the sample size (if plotting symbols are used).
(Note: the implementation here requires a little work on the part of the user to perform number 7 in the above list.)
Given the relationship between the mountain plot and the EDF plot, it is clear that they provide the same information;
however, some of the information is much easier to see in the mountain plot, including the median (and other percentiles), and
assessing symmetry. On the other hand, as Monti points out, there are limitations to the mountain plot (e.g., the density curve
is obscured).
The syntax of mountain is
mountain varname [if exp [in range [, nograph graph_options ]
More intriguing information
1. The name is absent2. Who runs the IFIs?
3. Ultrametric Distance in Syntax
4. The name is absent
5. The name is absent
6. The name is absent
7. The name is absent
8. Flatliners: Ideology and Rational Learning in the Diffusion of the Flat Tax
9. The InnoRegio-program: a new way to promote regional innovation networks - empirical results of the complementary research -
10. Dynamic Explanations of Industry Structure and Performance