Whatever Happened to Competition in Space Agency Procurement? 229
Figure 2. Recursive graphics
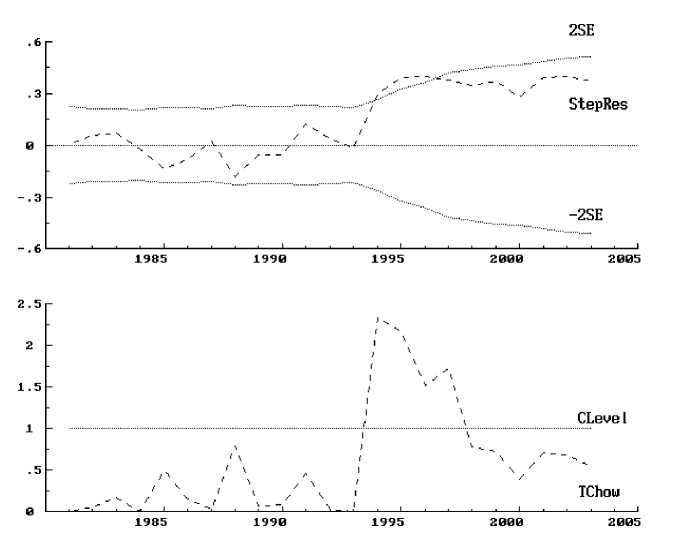
Notes: The recursive graphics are based on the recursive least squares (RLS) estimation
with LNASAnc as dependent variable and LSENASA and LNASAtop10 the independent varia-
bles. The use of the RLS method of estimation (see Doornik and Hendry, 1995) is chosen to
graphically illustrate the presence of structural breaks. The methodology employed by the
recursive method of estimation of a model for a sample with T observations is to apply
successive OLS estimates to the model starting with M observations (M<T), and then fit
the model to M+1, M+2,... up to T observations (Doornik and Hendry, 1995: 140). This way
a number of successive residual sums of squares are obtained based on which a sequence
of tests for structural breaks and parameter constancy can be conducted (ibid: 268). Two
graphics-based tests for parameter constancy are presented. The top graph presents the
one-step residuals test, where the one-step residuals of yt - xtβt (StepRes) are bordered
by plus and minus two standard deviations from M to T sample observations (2SE and -
2SE, respectively). Points outside the boundaries reveal coefficient changes. The lower
graph presents the one-step Chow test, which is based on one-step forecast tests (TChow)
following the F-distribution with 1, t-k-1 degrees of freedom for t=M,...,T and a null of
parameter constancy (Doornik and Hendry, 1995: 328). Points above a chosen (5%) level
of significance in the diagram (CLevel) reveal the time period for which the null is rejected.
Both graphs are for M=5 and reveal a major structural break in 1994, as expected.
More intriguing information
1. THE CHANGING RELATIONSHIP BETWEEN FEDERAL, STATE AND LOCAL GOVERNMENTS2. Regional specialisation in a transition country - Hungary
3. The name is absent
4. The name is absent
5. The name is absent
6. Social Balance Theory
7. The name is absent
8. The name is absent
9. Benchmarking Regional Innovation: A Comparison of Bavaria, Northern Ireland and the Republic of Ireland
10. An Investigation of transience upon mothers of primary-aged children and their school