Figure 1: Time-Series Plots, Daily Average Temperature
100
Atlanta
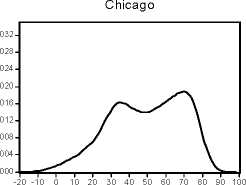
Chicag o
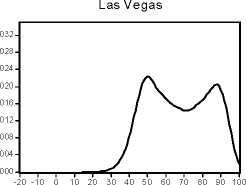
Las Vegas
Philadelphia
80
60
40
20
0
-20
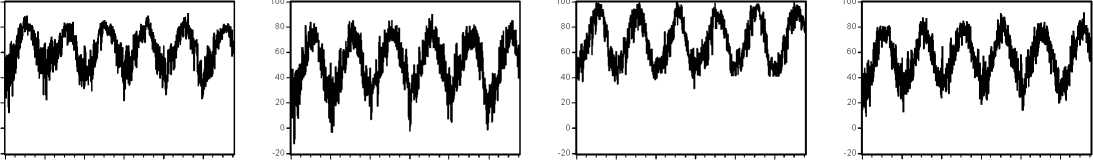
1996 1997 1998 1999 2000 2001
1996 1997 1998 1999 2000 2001
1996 1997 1998 1999 2000 2001
1996 1997 1998 1999 2000 2001
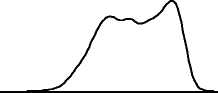
Figure 2: Estimated Unconditional Distributions, Daily Average Temperature
Atlanta
.032∙
.028∙
.024∙
.020∙
.016-
.012-
.008∙
.004 •
.000-
-20 -10 0 10 20 30 40 50 60 70 80 90 100
.032∙
.028∙
.024∙
.020∙
.016-
.012∙
.008∙
.004∙
.000∙
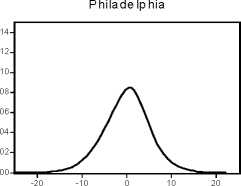
Philadelphia
-20 -10 0 10 20 30 40 50 60 70 80 90 100
Figure 3: Estimated Model Residuals, Daily Average Temperature
Atlanta
Chicag o
Las Vegas
Philadelphia
30
20
10
0
-10
-20
-30
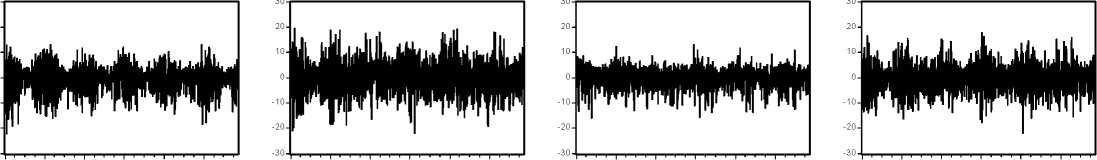
1996 1997 1998 1999 2000 2001
1996 1997 1998 1999 2000 2001
1996 1997 1998 1999 2000 2001
1996 1997 1998 1999 2000 2001
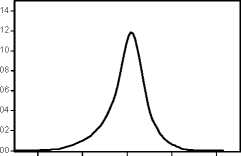
Figure 4: Estimated Unconditional Distribution of Residuals, Daily Average Temperature
Atlanta
-20 -10
10 20
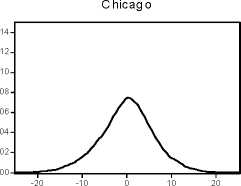
.14.
.12-
,10.
.08.
.06.
.04.
.02∙
.00-
Las Vegas
-20 -1 0 0 10 20
More intriguing information
1. Tariff Escalation and Invasive Species Risk2. The name is absent
3. Transport system as an element of sustainable economic growth in the tourist region
4. Sex-gender-sexuality: how sex, gender, and sexuality constellations are constituted in secondary schools
5. The name is absent
6. Do imputed education histories provide satisfactory results in fertility analysis in the Western German context?
7. Strategic Effects and Incentives in Multi-issue Bargaining Games
8. The name is absent
9. The name is absent
10. Income Growth and Mobility of Rural Households in Kenya: Role of Education and Historical Patterns in Poverty Reduction