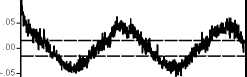
Figure 5: Correlogram of Squared Residuals, Daily Average Temperature
.15∙
,10.
.05∙
.00∙
-.05∙
-.10∙
-.15∙
Atlanta
C hicag o
Philade Ip hia
100 200 300 400 500 600 700 8 0
'15^Γ
.10-
-.10-
15 j-------------1-------------1-------------1-------------1-------------1-------------1-------------1-------------
100 200 300 400 500 600 700 800
Las Vegas
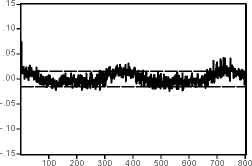
.15.
.10-
.05-
.00-
-.05-
'√V
-.10-
-.15 -------------1-------------1-------------1-------------1-------------1-------------1-------------1-------------
100 200 300 400 500 600 700 8 0
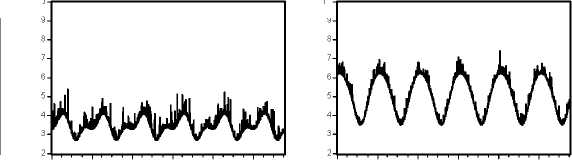
Figure 6: Estimated Conditional Standard Deviations, Daily Average Temperature
10-
2.
Atlanta
9-
8-
7-
6-
5-
4-
3-
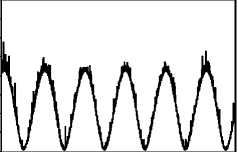
1996 1997 1998 1999 2000 2001
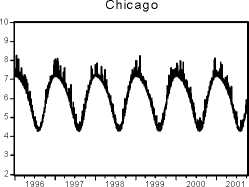
Las Vegas
Philadelphia
10
10-
9-
9
1996 1997 1998 1999 2000 2001
1996 1997 1998 1999 2000 2001
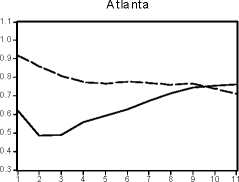
Figure 7: Forecast Skill Relative to Persistence Forecast, Daily Average Temperature Point Forecasts
1.1-
0.3-τ
Chicago
1.0-
0.9-
0.8-
0.7-
0.6-
0.5-
0.4-
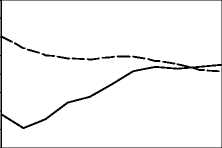
12345678 9 10 11
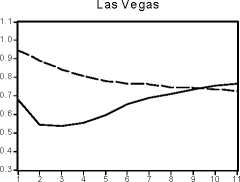
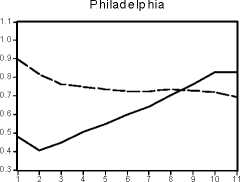
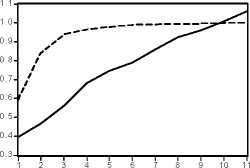
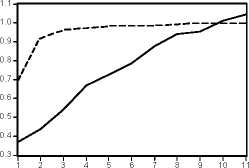
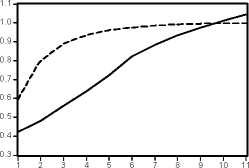
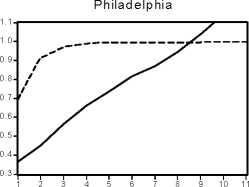
Figure 8: Forecast Skill Relative to Climatological Forecast, Daily Average Temperature
Atlanta
Chicag o
Las Vegas
More intriguing information
1. The name is absent2. Palvelujen vienti ja kansainvälistyminen
3. Evidence on the Determinants of Foreign Direct Investment: The Case of Three European Regions
4. Fiscal Reform and Monetary Union in West Africa
5. The name is absent
6. ENVIRONMENTAL POLICY: THE LEGISLATIVE AND REGULATORY AGENDA
7. Neural Network Modelling of Constrained Spatial Interaction Flows
8. Poverty transition through targeted programme: the case of Bangladesh Poultry Model
9. The name is absent
10. ISSUES AND PROBLEMS OF IMMEDIATE CONCERN