Wiemer Salverda
Figure 1 Increasing* life expectancy (years) on calendar basis according to sex, age and
period, 1861-2050
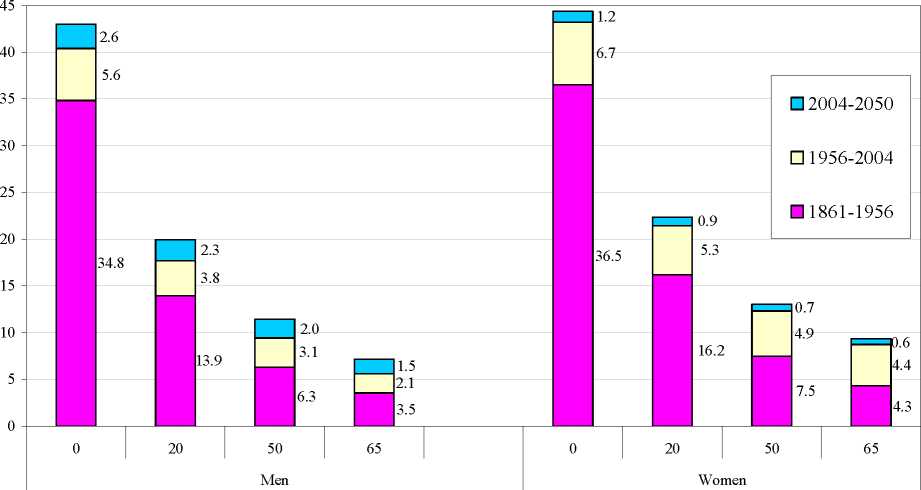
*) Later years as compared to the situation of 1861-65
Source: estimated from Statistics Netherlands (CBS)∕Statline Historical survival tables and current forecast 2004-2050.
Figure 1 shows the growth in life expectancy at different ages from the start of statistics-keeping in
the period 1861-65 until 2050, which is as far ahead as official projections currently extend. These
are sample sections of the population per calendar year for four different ages (0, 20, 50 and 65) and
hence different birth years. We see that the enormous gain of more than 40 years, which
corresponds to the total height of the column at birth, 0 years, is already halved by the age of 20,
and gradually drops further to 7 years (for men) or 9 (for women) at 65 years - that is only one fifth
of the gain at birth.
The tripartite division of the columns also shows trends over three subperiods: before the
introduction of the public old-age pension (AOW) in the period 1956-1960, from then until the
present (2004) and from now until 2050. Because the greatest gain at birth - 35 of the 40 years -
was made during the first subperiod, it was already behind us when the pension was introduced.
Later there are only 8 additional years (5.6 + 2.6 and 6.7 + 1.2 for men and women respectively)
until 2050. In later periods the growth at older ages is relatively more significant, particularly for the
oldest women, but it remains slight in terms of absolute number of years. Men aged 65 have gained
only 2.1 years since the AOW was introduced. Conspicuously, the future growth for women - the
upper part of the columns - works out lower than for men for all four ages. It should be noticed
that a larger share of the figure than may at first appear is based on projections rather than actual
12
AIAS - UvA
More intriguing information
1. Regional science policy and the growth of knowledge megacentres in bioscience clusters2. The name is absent
3. EXECUTIVE SUMMARY
4. 03-01 "Read My Lips: More New Tax Cuts - The Distributional Impacts of Repealing Dividend Taxation"
5. Public-Private Partnerships in Urban Development in the United States
6. Convergence in TFP among Italian Regions - Panel Unit Roots with Heterogeneity and Cross Sectional Dependence
7. PROPOSED IMMIGRATION POLICY REFORM & FARM LABOR MARKET OUTCOMES
8. The name is absent
9. The name is absent
10. Applications of Evolutionary Economic Geography