54
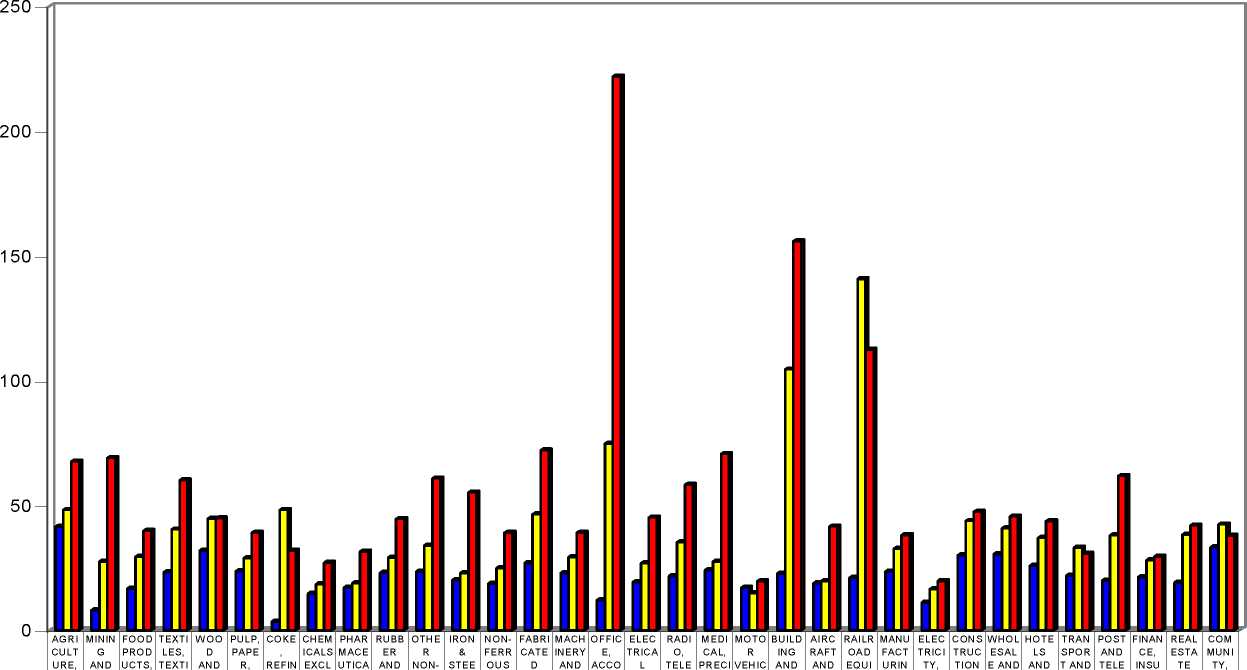
Figure 2: UK: Jobs Created Economy Wide (in the VIS) by £1m 1998
|
■ 1998 |
41,5 |
8 |
16,7 |
23,2 |
31,9 |
23,6 |
3,5 |
14,7 |
17,1 |
23 |
23,5 |
20,1 |
18,7 |
26,9 |
22,9 |
12 |
19,2 |
21,7 |
24,1 |
17 |
22,7 |
18,8 |
21 |
23,5 |
11,1 |
30 |
30,5 |
25,8 |
21,8 |
19,9 |
21,3 |
19,1 |
33,2 |
|
□ 1990 |
48,2 |
27,5 |
29,4 |
40,4 |
44,7 |
28,9 |
48,2 |
18,4 |
18,8 |
29,1 |
33,9 |
22,9 |
24,9 |
46,5 |
29,3 |
74,7 |
26,8 |
35,2 |
27,5 |
14,9 |
104,5 |
19,7 |
140,7 |
32,6 |
16,4 |
43,8 |
40,9 |
37 |
33,1 |
38 |
28 |
38,3 |
42,4 |
|
■ 1979 |
67,6 |
69 |
39,8 |
60,1 |
44,9 |
39,1 |
31,8 |
27 |
31,5 |
44,6 |
60,8 |
55,2 |
39,1 |
72,1 |
39,1 |
221,9 |
45,2 |
58,3 |
70,6 |
19,6 |
155,9 |
41,6 |
112,5 |
38,1 |
19,7 |
47,5 |
45,6 |
43,7 |
30,6 |
61,8 |
29,5 |
42 |
37,9 |
More intriguing information
1. Connectionism, Analogicity and Mental Content2. The voluntary welfare associations in Germany: An overview
3. Importing Feminist Criticism
4. Do Decision Makers' Debt-risk Attitudes Affect the Agency Costs of Debt?
5. Centre for Longitudinal Studies
6. Menarchial Age of Secondary School Girls in Urban and Rural Areas of Rivers State, Nigeria
7. The name is absent
8. Cryothermal Energy Ablation Of Cardiac Arrhythmias 2005: State Of The Art
9. Restructuring of industrial economies in countries in transition: Experience of Ukraine
10. SOCIOECONOMIC TRENDS CHANGING RURAL AMERICA